Insulin resistance is a growing problem and is a state in which a given concentration of insulin produces a less-than-expected biological effect. Insulin resistance has also been arbitrarily defined as the requirement of 200 or more units of insulin per day to attain glycemic control and to prevent ketosis.1 Several diseases and syndromes such as type 2 diabetes mellitus and metabolic syndrome are associated with insulin resistance.
Metabolic Syndrome is a state of insulin-resistance that has been known by many names: Syndrome X, Deadly Quartet or the Dysmetabolic Syndrome has drawn the greatest attention because of its public health importance. It is defined by the National Cholesterol Education Program Adult Treatment Panel III (NCEP ATP III) guidelines and included the presence of at least three criteria among the following: waist circumference at least 102 cm for men and at least 88 cm for women; triglyceride level of 150 mg/dL or higher; HDL-C level of less than 40 mg/dL in men or less than 50 mg/dL in women; blood pressure of 130/85 mm Hg or higher; fasting glucose level of >100 mg/dL.2
Due to the great risk of developing complications from insulin resistance, early detection and intervention are important to prevent the morbidity and mortality associated with these complications.
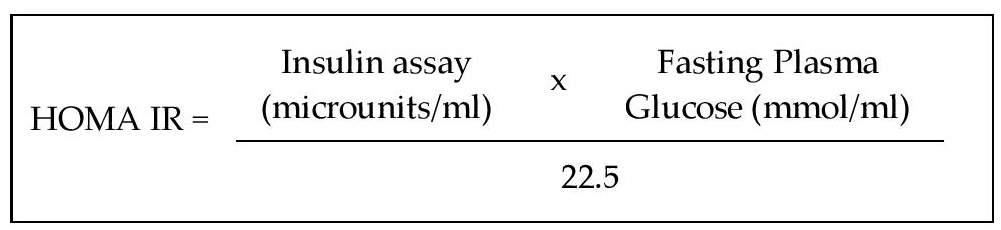
The gold standard for determining insulin resistance is to use the hyperinsulinemic-euglycemic clamp. This technique provides for a direct measure of glucose uptake under insulin-stimulated conditions. Given the complicated nature and potential hypoglycemic effect of the procedure, the Homeostatic Model Assessment (HOMA) is considered an alternative method which is a simple and easy method to determine the presence of insulin resistance.13 The formula of HOMA-IR is fasting blood sugar (mmol/ml) x insulin assay (microunits/ml)/22.5.13
Several studies have shown that epicardial fat thickness has a positive correlation with insulin resistance.2-5 Since the hyperinsulinemic-euglycemic clamp technique is tedious and carried out only in research laboratories and because insulin assays are expensive, this paper seeks to investigate whether epicardial fat thickness measurement through routine 2D echocardiogram can be a diagnostic tool for predicting insulin resistance.
The general objective is to determine if epicardial fat thickness can be an early marker of insulin resistance.
Specific objectives are: 1) to determine the specific thickness of epicardial fat that will correlate with insulin resistance and 2) to correlate epicardial fat thickness with co-morbidities, anthropometric measures, fatty liver infiltration abdominal ultrasound and other clinical variables.
The study used a cross-sectional design among subjects undergoing in and out patient executive check-ups at the Cardinal Santos Medical Center from August to September 2010. Letters were sent out to doctors for recruitment of subjects. The initial result consisted of a total of 35 subjects who underwent inpatient or outpatient executive check-up. Subjects were prospectively recruited using a non-probability, purposive, prospective sampling. Baseline clinical data and blood samples were collected. Insulin resistance was measured using the HOMA-IR equation. Epicardial fat thickness was measured through 2D echocardiogram (Appendix A).
Must be male or female between 18-80 years of age
With anthropometric measurements, specifically weight (kg), height (cm), waist and hip circumference (cm)
Must have 2D echocardiogram to measure the epicardial fat thickness
Must have fasting blood sugar (FBS) and insulin assay
No acute severe illness (i.e., pneumonia, sepsis or other severe infection)
Consent forms were forwarded to the attending physicians of the subjects selected.
A purposive sampling was done among patients coming in for in or out patient executive check up and the following baseline data were obtained for each patient:
age (18-80 years old)
gender
body mass index (BMI) kg/m2
blood pressure (mmHg)
waist circumference (cm)
fasting blood sugar (mmol/ml)
fasting insulin level (microunits/ml)
2D echocardiogram measuring epicardial fat thickness (mm)
fatty liver diagnosed by abdominal ultrasound
lipid profile (mg/dl) - total cholesterol, low density lipoprotein (LDL), high density lipoprotein (HDL), triglycerides
Insulin resistance determination using Homeostatic Model Assessment (HOMA-IR)
Anthropometric measurements were collated. Weight in kilograms and height in centimeters were measured. BMI (kg/m2) was calculated. Waist circumference, the minimum circumference, located between the lower rib margin and the iliac crest or midwaist and hip circumference, over the greater trochanters were measured. Hip to waist ratio was computed. The researchers did all measurements.
Epicardial fat thickness was measured using GE VIVID 7 (high resolution) 2D echocardiogram. Free wall of the right ventricle from both parasternal-long and short-axis and subcostal region views were chosen for measurement of epicardial fat thickness for two reasons: 1) this point is recognized as the highest absolute epicardial fat layer thickness; and 2) parasternal long-and short-axis views allow the most accurate measurement of adipose tissue on right ventricle, with optimal cursor beam orientation in each view.4,6,10 Epicardial fat thickness is best measured at end-systole because it is compressed during diastole. Epicardial fat thickness was measured by a single reader.
The subject was fasted for 12 hours prior to taking the blood sample for FBS using hexokinase, lipid profile using the Dade assay and fasting insulin level using enzyme immunoassay. Blood samples were stored at 0.2-0.80C temperature and were brought to Asiatic Laboratories for analysis. Fatty liver infiltration was checked using LOGIC 7 GE (high resolution) ultrasound. Abdominal ultrasound was viewed and measured by a single reader.
Insulin resistance was computed using the Homeostatic Model Assessment (HOMA-IR).
The HOMA is a reliable marker for measuring insulin resistance among patients with or without diabetes mellitus. This has been proven by the studies of Lansang8 and Bonora.13 Both researchers compared HOMA with the glucose clamp technique and concluded that HOMA can be a less tedious and less expensive alternative for measuring insulin resistance. Based on the Bruneck Study, a HOMA-IR value of 2.77 was chosen as the threshold for insulin resistance.13 Low HOMA-IR values indicate a high insulin sensitivity, whereas high HOMA-IR values indicate a low insulin sensitivity (insulin resistance).
SPSS software package version 19 and EPI info version 3.5.1. were used for statistical analysis. Correlation analysis was performed by the Pearson test. Linear regression analysis was performed on all anthropometric, co-morbidities and clinical variables to identify correlates with epicardial fat thickness.
Correlation Coefficient was computed to see the degree of association of patient characteristics, clinical variables and HOMA-IR with epicardial fat thickness.
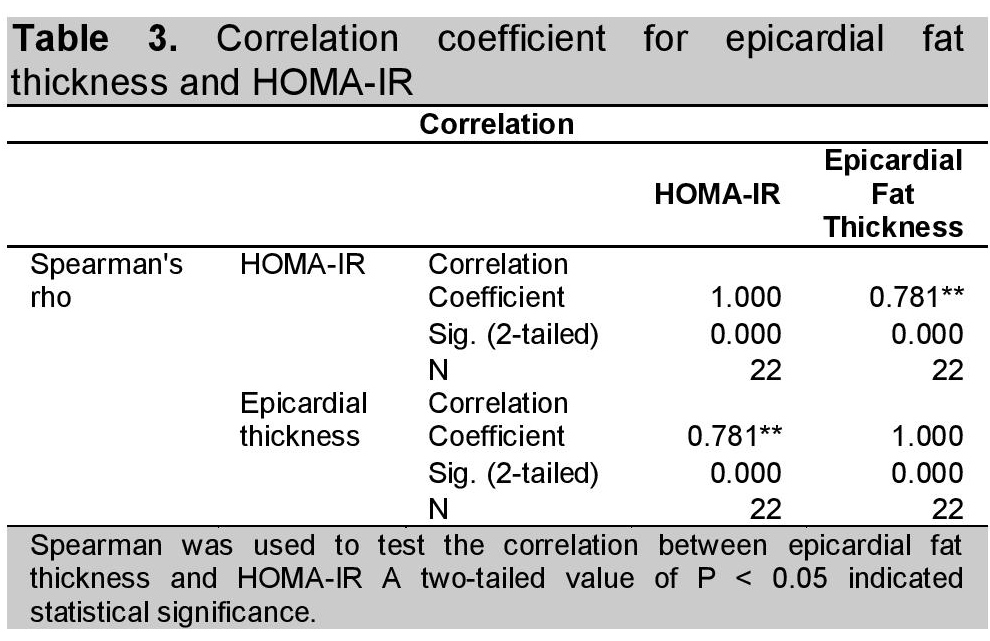
Spearman's rho was used to test the correlation between epicardial fat thickness and HOMA-IR.
A total of 35 subjects was recruited for the study. However, 11 subjects did not have fasting insulin levels and 2 subjects did not have 2D echo result. A total of 22 subjects was included in the study. Five subjects were considered overweight and 6 subjects were considered obese based on their BMI and waist to hip ratio using the WHO criteria and definition. Based on the data, 36% of the study population, had insulin resistance. Of the 10 previously known diabetics, 60% had insulin resistance.
Table 1 shows the demographic characteristics of the subjects. The mean age of the subjects is 57.31 (SD=13.63) and there is male preponderance (72.7% ; n=16). Mean BMI 26.16 (SD=4.81) and is above the normal range based on WHO criteria. Mean HOMA 2.77 (SD=1.87) and mean epicardial fat thickness of 9.03 (SD=4.47) were found to be within normal range. Only 18.2% (n=4) had fatty infiltration of the liver based on their abdominal ultrasound.
Click here to download Table 1Table 1. Demographic profile of the study population
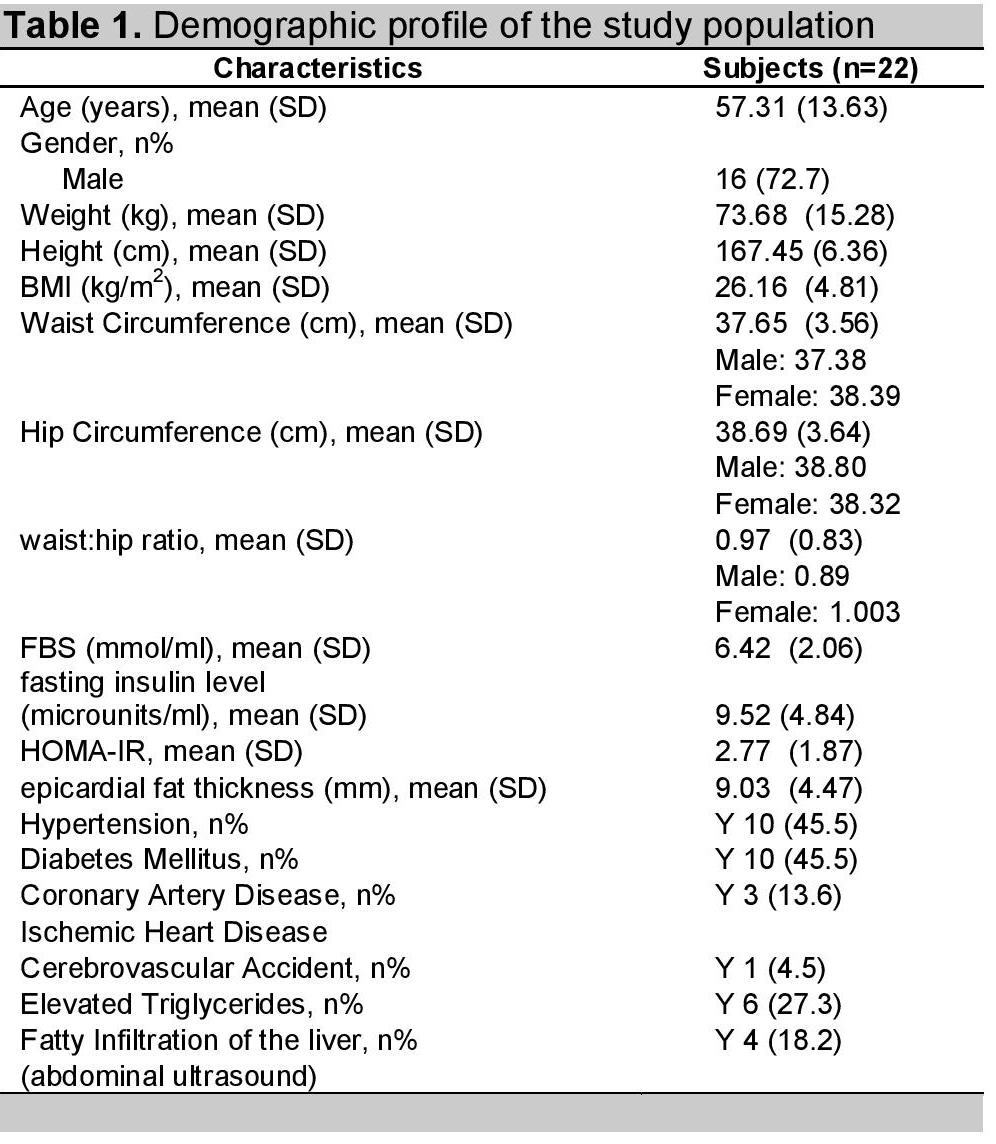
Prevalence of insulin resistance in these subjects was 45.5%, using the NCEP ATP III criteria. Of the 10 subjects who had both hypertension and diabetes mellitus, 6 or 60% had insulin resistance.
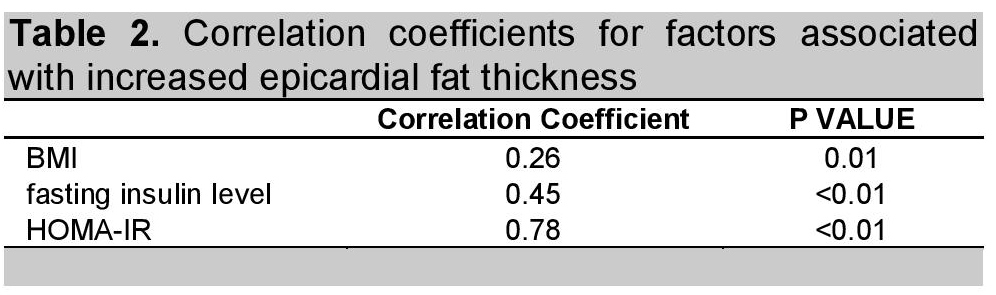
To check for factors associated with increased epicardial fat thickness, correlation coefficients were computed and is summarized in Table 2. Among the factors, age (r = 0.00, p-value 0.95), gender (correlation coefficient 0.01, p-value 0.63), hypertension (r = 0.00, p-value 0.89), diabetes mellitus (r = 0.09, p-value 0.17), Cerebrovascular accident (CVA) (r = 0.09, p-value 0.17), Coronary artery disease (CAD)/Ischemic heart disease (IHD) (r = 0.05, p-value 0.32), hypercholesterolemia (r = 0.01, p-value 0.70), waist to hip ratio (r = 0.04, p-value 0.37), presence of fatty liver thru abdominal ultrasound (r = 0.00, p-value 0.89), FBS (r = 0.20, p-value 0.37) were not significantly correlated to epicardial fat thickness.
BMI (p-value 0.01), fasting insulin level (p-value <0.01) and HOMA-IR (p-value <0.01) were shown to be significantly correlated with epicardial fat thickness. Correlation between epicardial fat thickness and HOMA-IR was highest at 0.78, showing statistical significance (Table 2).
Click here to download Table 2Table 2. Correlation coeffecients
The correlation between epicardial fat thickness and HOMA-IR was tested with Spearman correlation coefficient. A two-tailed value of P <0.05 indicated statistical significance (Table 3).
Click here to download Table 3Table 3. Correlation coefficient for epicardial fat thickness and HOMA-IR
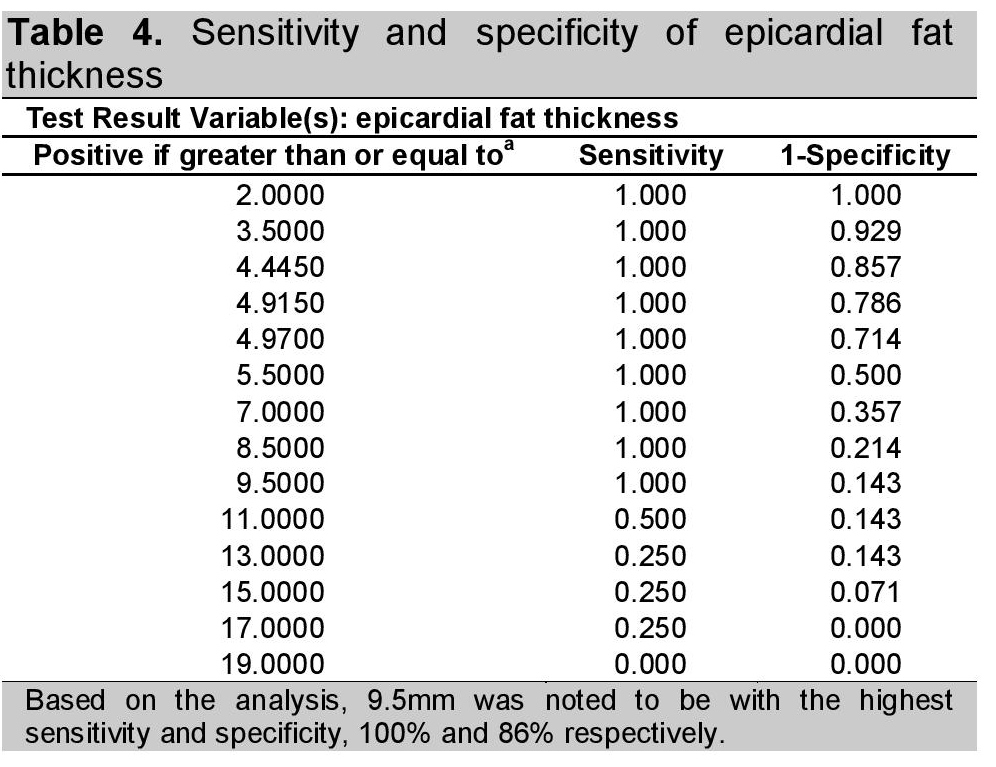
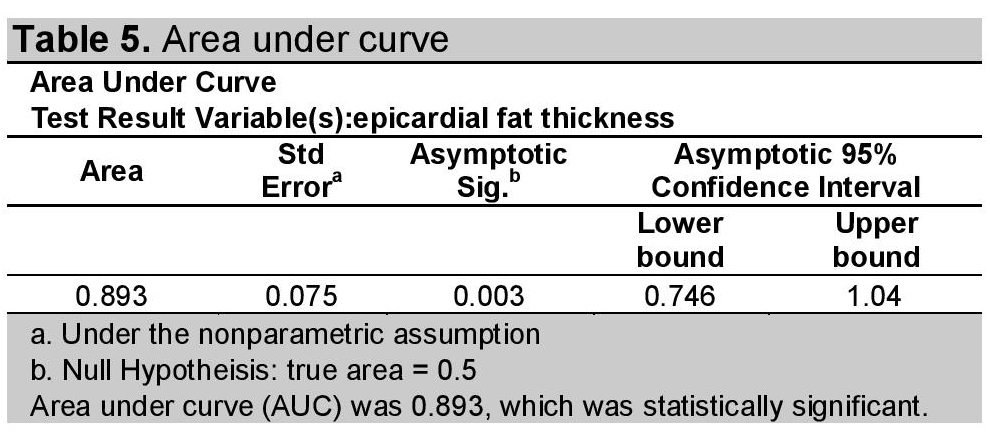
Based on the analysis, 9.5 mm had the highest sensitivity and specificity, 100% and 86% respectively (Table 4). Area under curve (AUC) was 0.893 with 95% confidence interval of 0.746 to 1.040 (Table 5).
Click here to download Table 4Table 4. Sensitivity and specifity of epicardial fat thickness
Click here to download Table 5
Table 5. Area under curve
In the research done by Iacobellis,14 ,the study also proposed ≥9.5 mm as a cut-off of epicardial fat thickness for determining presence of insulin resistance.
Using the Spearman's rho, there is a significant correlation between HOMA-IR cut off of 2.77 and epicardial fat thickness cut off of 9.5 mm as shown in Table 6.
Click here to download Table 6Table 6. Correlation coefficient of HOMA-IR using 2.77 and epicardial fat thickness using 9.5mm
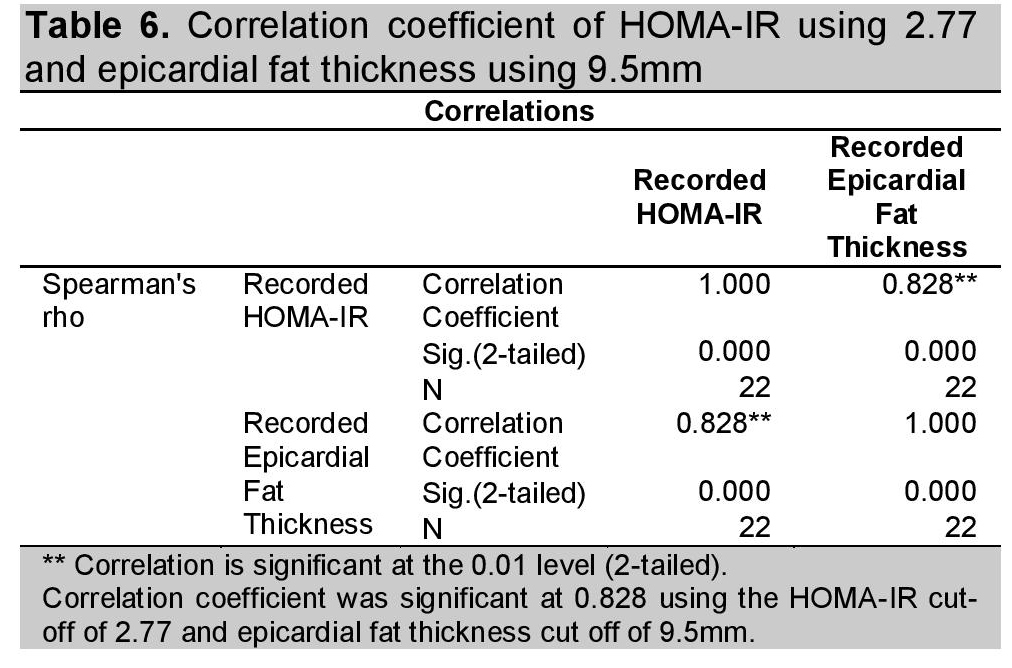
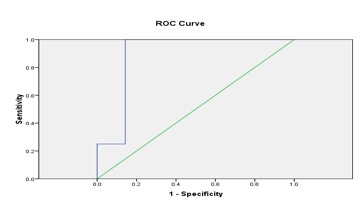
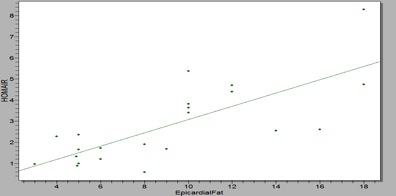
Figure 1 shows the sensitivity and specificity of epicardial fat thickness in predicting the presence of insulin resistance while figure 2 shows the positive correlation between echocardiographic epicardial fat thickness and HOMA-IR.
Click here to download Figure 1Figure 1. Shows that epicardial fat thickness is both sensitive and specific in predicting presence of insulin resistance
Click here to download Figure 2
Figure 2. Showsa good agreement of echocardiographic epicardial fat thickness and HOMA-IR (n=22)
Insulin resistance is an emerging problem, necessitating prompt treatment. HOMA-IR is the diagnostic of choice for determining the presence of insulin resistance. However, insulin assay is expensive and tedious, requiring a 12 hour fast before blood extraction. Epicardial fat thickness has been associated with insulin resistance. Hence, measurement of epicardial fat thickness through routine 2D echocardiogram can be an alternative diagnostic test for diagnosing insulin resistance, since it is cheaper, less tedious and more available compared to insulin assay.
Our results showed that epicardial fat thickness is correlated with insulin resistance using HOMA-IR. A similar study by Aydin,2 showed that epicardial fat thickness correlated with several factors including HOMA-IR. Epicardial fat thickness threshold of ? 9.5mm was noted to be correlated with insulin resistance. A similar study by Iacobellis,6 proposed that ≥9.5 mm epicardial fat thickness be the cut-off value for diagnosing metabolic syndrome, increased abdominal fat and insulin resistance, while ≥11mm be the cut-off for high insulin resistance.
Several studies show that obesity is associated with insulin resistance.4,15 Anthropometric measurements are widely used, but are frequently imprecise. Although waist circumference is widely accepted as a good predictor of intraabdominal fat mass, imaging techniques are more precise and reliable.10 Magnetic Resonance imaging is the gold standard for measuring visceral adipose fat but is expensive.
Hence, this study proposes routine 2D echocardiogram with the measurement of the parasternal long-and short-axis view and subcostal regions to be an alternative method for measuring epicardial adipose tissue thickness.
Using the correlation coefficient, BMI was noted to be significantly correlated with epicardial fat thickness as shown in Table 2. The study by Iacobellis,4 showed that epicardial fat is significantly related to obesity-related insulin resistance. Obesity is frequently associated with insulin resistance and abnormalities in glucose metabolism. Although visceral fat in the trunk is known to be correlated with insulin resistance in both diabetic and non-diabetic subjects, extra-abdominal fat depots including mediastinal and epicardial adipose tissues, have only recently been considered.4
Another variable which was found to be significantly correlated to epicardial fat thickness was fasting insulin level. Studies done by Iacobellis4 and Hizli15 showed that fasting insulin level was one of the factors that was significantly correlated to epicardial fat thickness. Both papers included obese subjects.
The 2D Echocardiogram can be used as an early marker of insulin resistance. The computed threshold for epicardial fat thickness of 9.5 mm, which is significantly correlated to HOMA-IR, can be used as a cut-off for predicting presence of insulin resistance.
The limitations of the study include a small sample size primarily due to financial limitations.
The authors recommend that the study be extended to include more subjects to increase the power. Nonetheless, based on the result of this research paper, the authors recommend the measurement of epicardial fat thickness at the free wall of the right ventricle from both parasternal long and short-axis and subcostal regions in all routine 2D echocardiogram evaluations, with a cut-off value of 9.5 mm for early detection of insulin resistance. It is non-invasive, less tedious and a relatively inexpensive method to identify at risk individuals for insulin resistance.
The authors thank Mrs. Ella Leonor and Jobert Mejia, MD for performing and reading the 2D echocardiogram of patients included in the study; the Medical Technologists of CSMC for extracting and saving blood for FBS and insulin assay and Asiatic Laboratories for providing the results of insulin assay, Dr. Ernesto Cruz Tan and Ms. Jasmine Navarro for providing financial support; Dr. Noel Espallardo for helping us with the statistics and the research committee of Internal Medicine Department for their support.
1. Martin WP, Martin HE, Lyster RW. Insulin resistance; Critical survey of the literature with the report of a case. J Clin Endocrinol. May 1941;1: 387-397.
2. Aydin H, Toprak A, Deyneli O, et al. Epicardial fat tissue thickness correlates with endothelial dysfunction and other cardiovascular risk factors in patients with Metabolic Syndrome. Metab Syndr Relat D. 2010; 8 (3):229-234. http://dx.doi.org/10.1089/met.2009.0080.
3. Chao-Ping W, Hui-Ling Hsu, Wei-Chin H, et al. Increased epicardial adipose tissue (EAT) volume in type 2 diabetes mellitus and association with metabolic syndrome and severity of coronary atherosclerosis. Clinical Endocrinology 2009; 70:876-882. http://dx.doi.org/10.1111/j.1365-2265.2008.03411.x.
4. Iacobellis G, Leonetti F. Epicardial adipose tissue and insulin resistance in obese subjects. J Clin Endocrinol Metab. 2005; 90 (11):6300-6302. http://dx.doi.org/10.1210/jc.2005-1087.
5. Iacobellis G, Barbaro G, Gerstein H. Relationship of epicardial fat thickness and fasting glucose. Int J Cardiol. 2008; 128:424-426. http://dx.doi.org/10.1016/j.ijcard.2007.12.072.
6. Iacobellis G, Willens H. Echocardiographic epicardial fat: A review of research and clinical applications. State of the Art Review Article. J Am Soc Echocardiogr. 2009; 22 (12):1311-1319. http://dx.doi.org/ 10.1016/j.echo.2009.10.013.
7. Rosito G, Massaro J, Hoffmann U, et al. Pericardial fat, visceral abdominal fat, cardiovascular disease risk factors, and vascular calcification in a community-based sample. The Framingham Heart Study. Circulation. 2008; 117 (5):605-613. http://dx.doi.org/10.1161/ CIRCULATIONAHA.107.743062.
8. Lansang MC, Williams GH, Carroll JS. Correlation between the glucose clamp technique and the homeostatic model assessment in hypertension. Am J Hypertens. 2001; 14 (1):51-53. http://dx.doi.org/ 10.1016/S0895-7061(00)01229-2.
9. Bakari AG, Onyemelukwe GC. Insulin resistance in type 2 diabetic Nigerians. J Diabetes Metab. 2005; 13:24-27.
10. Iacobellis G, Ribaudo MC, Assael F, et al. Echocardiographic epicardial adipose tissue is related to anthropometric and clinical parameters of metabolic syndrome: A new indicator of cardiovascular risk. J Clin Endocrinol Metab. 2003; 88 (11): 5163-5168. http://dx.doi.org/10.1210/jc.2003-030698.
11. Sade LE, Eroglu S, Bozbas, H, et al. Relationship between epicardial fat thickness and coronary flow reserve in women with chest pain and angiographically normal coronary arteries. Atherosclerosis. 2009; 204 (2):580-585. http://dx.doi.org/10.1016/j.atherosclerosis.2008.09.038.
12. Iacobellis G, Willens H, Barbaro G, Sharma A. Threshold values of high-risk echocardiographic epicardial fat thickness. Nature Publishing Group, Basingstoke, Obesity. ISSN 2008; 16 (4):887-892.
13. Bonora E, Kiechl S, Willeit, J, et al. Prevalence of insulin resistance in metabolic disorders: The Bruneck Study. Diabetes. 1998; 47(10):1643-1649. http://dx.doi.org/10.2337/diabetes.47.10.1643.
14. Hasan A, Ahmet T, Og? uzhan D, et al. Epicardial fat tissue thickness correlates with endothelial dysfunction and other cardiovascular risk factors in patients with metabolic syndrome. Metab Syndr Relat D.2010; 8(3): 229-234.
15. Hizli S, Ozdemir O, Abazi A, Razi C, Kabakus N. Relationship of subepicardial adipose tissue thickness and clinical and metabolic parameters in obese prepubertal children. Pediatr Diabetes. 2010; 11(8):556-562. http://dx.doi.org/10.1111/j.1399-5448.2010.00644.x.
Click here to download Appendix A.Appendix A.Study Data Collection Form

Authors are required to accomplish, sign and submit scanned copies of the JAFES Declaration that the article represents original material that is not being considered for publication or has not been published or accepted for publication elsewhere.
Consent forms, as appropriate, have been secured for the publication of information about patients; otherwise, authors declared that all means have been exhausted for securing such consent.
The authors have signed disclosures that there are no financial or other relationships that might lead to a conflict of interest. All authors are required to submit Authorship Certifications that the manuscript has been read and approved by all authors, and that the requirements for authorship have been met by each author.