Molecular tests to detect disease-related genes are now widely used in many clinical laboratories worldwide.1-3 Direct sequencing technique is considered as the gold-standard approach for genotyping analysis. However, its limitations include low throughput and high cost, making genetic analysis laborious and expensive.4 Many techniques have been developed to minimize the use of direct sequencing and control costs while maintaining accuracy and efficiency. Early methods, such as single-stranded conformation polymorphism analysis (SSCP) and denaturing gradient gel electrophoresis (DGGE), are labor intensive and require considerable technical skills.5,6 Denaturing high performance liquid chromatography (DHPLC) is highly reliable only when gene targeting strategies are well-designed and analysis temperatures are optimized.7 More recently, pyrosequencing, fluorescently labeled hybridization probes and microarray-based genetic analyses have become popular methodologies, however, they are still considered costly because of highly technical post-data processing and analysis.8
High resolution melting (HRM) analysis, using applications of real-time PCR assays, is a well established, closed tube, rapid, and cost-effective genotyping technique that is based on the analysis of the melting profile of PCR products, using intercalating fluorescent dyes to monitor the transition during heating.9 This real-time PCR analysis method scans entire DNA and detects sequence variations and single base changes (SNPs) via monitoring of the change in fluorescence that results from gradual temperature-dependent release of intercalating fluorescent dyes. Discrimination between homozygous genotypes is represented by a slight shift in the melting temperature (Tm), while heterozygous genotypes by a change of the melting curve profile.10 In comparison with other real-time PCR methods, low-cost fluorescent dyes are used in HRM technique, which requires less optimization rather than other methods such as TaqMan, Fluorescence Resonance Energy Transfer and molecular beacons.11-13 Many recent publications have documented the successful use of HRM on several platforms for mutation scanning/genotyping, simultaneous mutation scanning and genotyping, methylation profiling and genotyping with unlabeled probes.14-18
Hypertension belongs to the alarming category of complex human diseases that cause significant morbidity and mortality worldwide. Unfortunately, despite recent advances in understanding and treating hypertension, its prevalence continues to rise.19-21 Hypertension may result from the combined effects of poor lifestyle choices and genetics. While modest lifestyle and dietary recommendations can prevent high blood pressure, inter-individual response indicates that the etiology of hypertension likely varies considerably among patients. Indeed, studies of ambulatory blood pressure measurements in twins suggest that essential hypertension has a strong genetic component.22 In fact, large-scale genome-wide association studies (GWAS) have shown great success in identifying candidate genetic markers associated with blood pressure and hypertension.23 The HRM is a simple and cost effective post PCR technique, enabling researchers to analyze genetic variations (i.e. SNPs) which may contribute to the development of hypertension. However, it requires method validation before it can be used for routine diagnostic applications.
Method validation is a standard procedure used to confirm that the analytical procedure employed for a specific test is suitable for its intended use.24 It involves establishing performance characteristics and limitations of a proposed method and identification of factors and variables which may change these characteristics and to what extent. Validation can be seen as a process to determine whether the laboratory is performing the correct or high quality test. According to the Organization for Economic Cooperation and Development (OECD) guidelines for Quality Assurance in Molecular Genetic Testing (2007), there is an obligation for laboratories to provide high quality results.25 Therefore, all methods implemented within a routine setting must be duly validated prior to their intended use.
In this study, the researchers evaluated an HRM-based method for molecular analysis of ATP2B1 rs2681472, a candidate genetic marker of hypertension using blood samples extracted from selected Filipino respondents of the 2008 National Nutrition Survey (NNS).26,27 Specifically, the study aimed to establish method accuracy, inter- and intra-day precision, instrument detection limits and linearity.
DNA template preparation
Extracted anonymized DNA samples from whole blood of selected respondents of the 2008 NNS were used for the study. The 2008 NNS employed the stratified multi-stage sampling frame of the Labor Force Survey (LFS) of the National Statistics Office (NSO). For this study, a total of seventy (70) participants, aged 20 years and over, were enrolled particularly those who met one of the following inclusion criteria: high blood pressure (SBP ≥130 mm Hg, DBP ≥85 mmHg), impaired or elevated fasting blood sugar (110 - =126 mg/dL), and abnormal blood lipid profile (total cholesterol =200 mg/dL; LDL-c =130 mg/dL; HDL-c <40 mg/dL; triglyceride =150 mg/dL). All the respondents signed an informed consent prior to conduct of DNA extraction from their whole blood specimens, following the Dried Blood Spot protocol of the QIAmp® DNA Mini Kit. The informed consent stated that the researchers will use the participants' blood specimens for DNA/genotyping applications. The research protocol was approved and cleared for implementation by the FNRI Institutional Ethics Review Committee with Registry No. 2012-05-10-0005-2.
The quality of DNA was assessed based on amplification of GAPDH gene, a human endogenous control (size = 256 bp). The GAPDH products were visualized in 2% agarose gel, ran in parallel with DNA positive control (Roche® Human Genomic DNA). The ability to amplify large (>200 bp) PCR products is predictive of high quality DNA. DNA amplification of DNA extracts remains a useful means of determining DNA quality.28,29 DNA was properly stored in AE buffer (Qiagen) solution and kept frozen at -40oC until further use.
Primer design and test for specificity in silico
Primer set specific for human ATP2B1 rs2681472 was designed using Primer3tm software.30 Forward and reverse primers targeted the region flanking SNP rs2681472 at chr12:90008959 (GRCh37/hg19). To ensure specificity of the chosen primer set sequences to the target gene, National Center for Biotechnology Information-Basic Local Alignment Search Tool (NCBI-BLAST) database was accessed. A 100% homology was obtained corresponding to a highly similar sequence to that of the target SNP with amplicon size of 121 base pairs.
Forward sequence:5' GCTACTTTTCTCACTTTCACTTGC 3'
Reverse sequence:5' TTCTGAGGATGTGGCATTTG 3'
The oligonucleotide sequences were submitted to Life Technologies (Invitrogen) for synthesis using standard cyano-ethyl phosphoramidite chemistry.
Target SNP amplification and HRM analysis
The method for HRM-PCR SNP analysis was adapted from Biorad™ Precision Melt Supermix Application Note No. 10022094 with minor modification.31 Briefly, the real-time PCR (20 µL) reaction was composed of 10 µL 2X SsoFast™ EvaGreen® Supermixes (Bio-Rad Laboratories, Hercules, CA), forward and reverse primer solution (3 uL) specifically targeting the 121 bp DNA fragment, nuclease-free water (3 uL) and DNA extracted from clinical and DNA positive control (4 µL). The reactions were set up in triplicates, in 96 well PCR plate and run on a CFX96® Real-Time PCR system (Bio-Rad). The CFX Manager™ software (Bio-Rad) was used to set up the sample arrangement on the PCR plate, to define PCR conditions, to monitor the amplification in real time and to view melting curves. The cycling parameters of PCR were as follows: 95 °C for 2 min followed by 35 cycles of 95 °C for 10 s, 60 °C for 30 s, 72 °C for 30 s, and then a hetero-duplex formation step including 95 °C for 10 s and 60 °C for 1 min. After the PCR amplification steps, melt curves for the products were generated by heating in 0.2 °C increments at a rate of 10 s/step for temperature range 65-95 °C.
Post-PCR HRM analyses
Analysis of melt curves were performed using Precision Melt Analysis™ software (Bio-Rad) by normalization and temperature-shifting of fluorescence data, followed by plotting of the difference in fluorescence. Data that are similar to each other were 'clustered' by the software and assigned a cluster number. The melt curves corresponding to each cluster were color coded for easy visualization. The cluster detection settings include melt curve shape sensitivity (default value of 50% clustering) and melting temperature (Tm) difference threshold (default of 0.15 degrees).
Analysis of SNPs using human blood samples and Determination of Method Accuracy
A total of 70 anonymized extracted DNA samples were analyzed for SNPs detection of ATP2B1, following the HRM-PCR method. Of these, eight different samples coming from each HRM curve were sent to DNA sequencing services laboratory to confirm identity of the sequences grouping on every curve. The sequences were identified using the nucleotide Basic Local Alignment Search Tool (nucleotide BLAST, http://blast.ncbi.nlm.nih.gov/Blast.cgi) and aligned using MultAlin software (http://multalin.toulouse.inra.fr/multalin/). Concordance between the melting analysis and sequencing was determined and presented in % concordance. The higher the concordance with the known gold standard of measurement generally indicated higher accuracy of SNP genotype calls.
Determination of inter- and intra-day precision
To assess the repeatability of the real-time PCR protocol, the intra-assay and inter-assay coefficients of variation (CV) were evaluated, based on the measured Tm, as derived from the HRM curve. The precision of a laboratory procedure is conveniently expressed as coefficient of variation of a series of measurements. For intra-day-assay CV calculation, standard DNA samples were prepared in five replicates at one concentration level in one trial run. For interday-assay CV calculation, the same DNA samples were analyzed in three different trial runs performed on five different days using freshly prepared reagents.
Determination of Instrument Detection Limit (IDL) and Limit of Quantification (LOQ)
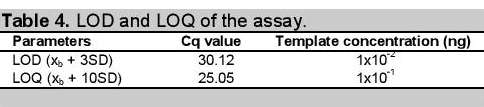
The IDL was detected using a very low concentration of DNA template containing the SNP of interest. Five solutions containing equal concentrations of DNA template were prepared to establish IDL and LOQ of the assay. The Cq values of each solution were noted and IDL and LOQ were calculated according to the following formulas:
LOD= xb + 3SD; xb =mean value; SD = standard deviation
LOQ= xb + 10SD; xb =mean value; SD = standard deviation
Determination of linearity and PCR efficiency
Freshly prepared serial dilutions (ten-fold) of amplified DNA samples were prepared. The dynamic range covered at least 5 orders of magnitude or level of DNA concentrations. Linearity of the protocol was assessed by graphically plotting the amplification of the DNA template (in relative fluorescence unit) versus different concentrations (in Cq values) of the DNA template.
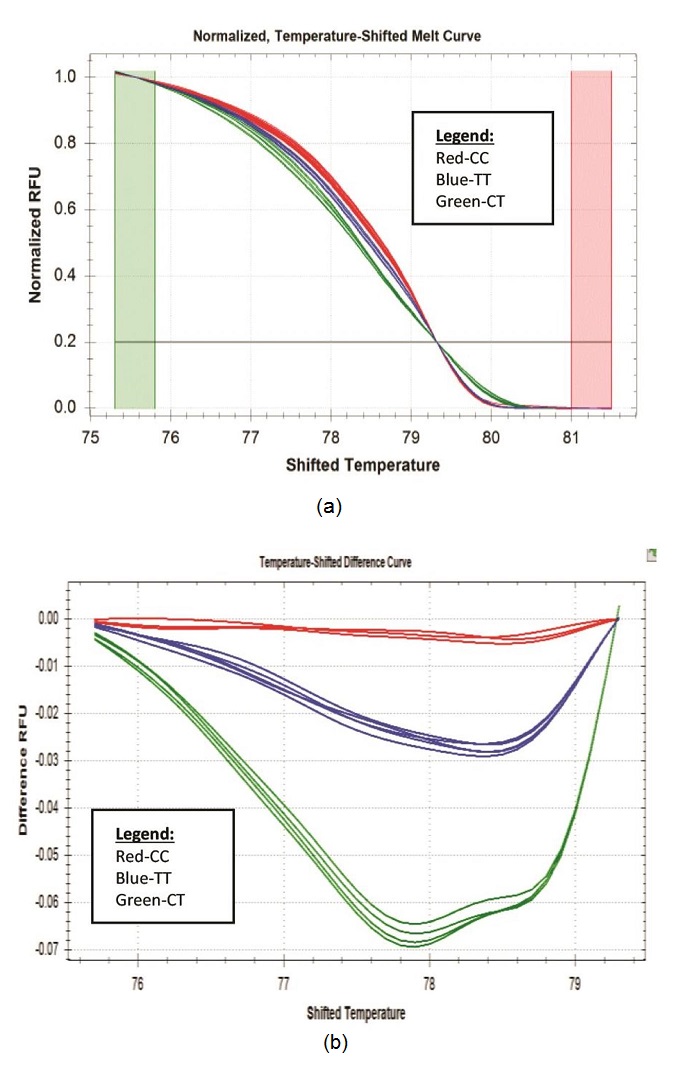
One approach to the detection of DNA variation is through HRM technology. The technique requires the use of standard PCR reagents with incorporation of saturating dsDNA binding dye. This closed tube method has advantages over current mutation scanning techniques since it requires no post-PCR handling and no separation step, which improves analysis time.10 Hence, more analysis can be done in such a short period of time with minimal risk of cross-contamination. HRM analysis starts with PCR amplification of the region of interest in the presence of a dsDNA binding dye. Amplification is followed by a high resolution melting step using instrumentation capable of capturing a large number of fluorescent data points per change in temperature. Melting temperature differences of PCR products are not always useful for genotype discrimination. However, high-resolution melting of PCR products with dsDNA dyes has been shown to identify a single base pair change in amplicons as large as 544 bp.32 Utility of this application was validated in-house to identify SNPs residing within ATP2B1 gene, particularly rs2681472, a candidate genetic marker of hypertension, using selected DNA samples collected from the 2008 NNS. Figure 1 shows the results of the HRM analysis (n=70). The HRM data were analyzed using the Precision Melt Analysis Software generating melt curve (fluorescence vs temperature). The software allows automated clustering of related sequences based on Tm shifts and melting curve shape. Figure 1a shows that there exists three SNP genotypes among the 70 analyzed samples. In HRM, melt curves formed from two different homozygous genotypes are discriminated against by Tm shifts. Whereas heterozygous genotype is readily distinguished by formation of four duplexes following PCR: two heteroduplexes and two homoduplexes, giving a skewed composite melting curve. To visualize the three genotypes (CC, CT and the TT risk genotype) clearly, melt curves were then converted to negative first derivative melting plots/ temperature-shifted difference curve (Figure 1b) that revealed melting transitions of the hybrids as peaks. The assignment of the peaks, generally, followed that single peaks corresponded to homozygous genotype and two peaks for heterozygous genotype. Between homozygous genotypes, identification of peaks was performed based on hydrogen bond pairing: G-C base pairing that have three hydrogen bonds between them is expected to have a higher melting temperature than DNA with A-T base pairing with only two hydrogen bonds. Hence, comparison between homozygous genotypes will produce higher melt behavior (stronger H bonding) on CC genotype than TT genotype.
Click here to download Figure 1Figure 1. (a) CFX96 HRM normalized graph. Genotypes were readily distinguished from the graph. The plot demonstrates the sharp decrease in fluorescence when the double-stranded DNA melts into its single-stranded form (b) CFX96 HRM temperature-shifted difference curve.
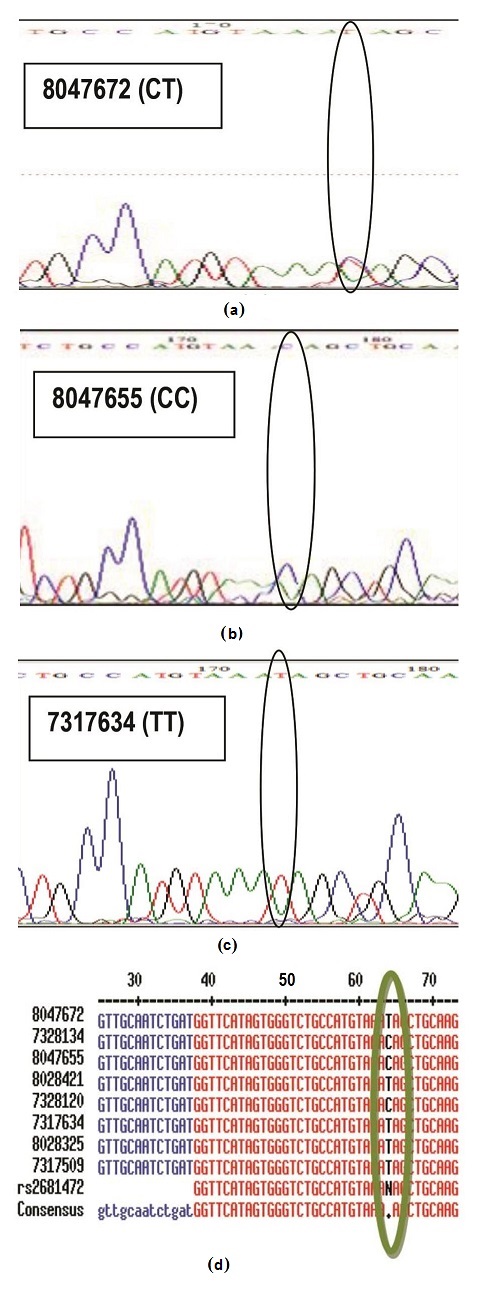
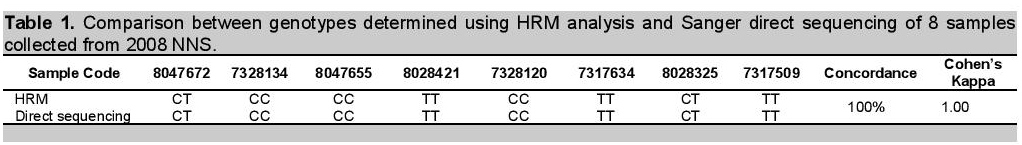
Accuracy of the method was evaluated by comparing results generated from HRM profiles to that of direct DNA sequencing (Figure 2). In direct DNA sequencing, since humans are diploid species, a single peak position within a trace of DNA sequencing electropherogram may have two peaks of different colors, corresponding to two different bases, instead of just one (heterozygous genotype behavior). Hence inspection of actual electropherogram using Bioedit® software was necessary to detect the base present in the polymorphic region. For example, sample 8047672 was called as TT genotype by the auto base caller of the sequencing machine, but looking at the electropherogram, a clear heterozygous SNP was observed, thus, the call was given to the actual sample as CT genotype (Figure 2a). The rest of the samples which had no existence of double peaks were called either as homozygote CC (Figure 2b) or TT (Figure 2c). Notably, from the samples that were subjected for sequencing, results were concordant (100%, Cohen's kappa = 1.00) with data from HRM analysis, thus, implying the method is accurate (Table 1). Several molecular methods for analyzing genetic markers may be used to establish ATP2B1 SNP typing accuracy aside from DNA direct sequencing. The earliest studies were based on methods such as denaturing gradient gel electrophoresis and restriction enzyme digestion of PCR products.5,6 More recently, pyrosequencing, fluorescently labeled hybridization probes, and microarrays, however considered costly methodologies, are equally advisable to be used as reference technology to assess accuracy of HRM.8
Click here to download Figure 2Figure 2. Sequencing data of representative for each genotype (a) CT genotype (b) CC genotype (c) TT genotype (d) Base calls were aligned using MultAlin software (http://multalin.toulouse.inra.fr/multalin/), accessed in November,2012.Sequencing was conducted by Macrogen, Inc. in Seoul, South Korea.
Click here to download Table 1
Table 1. Comparison between genotypes determined using HRM analysis and Sanger direct sequencing of 8 samples collected from 2008 NNS.
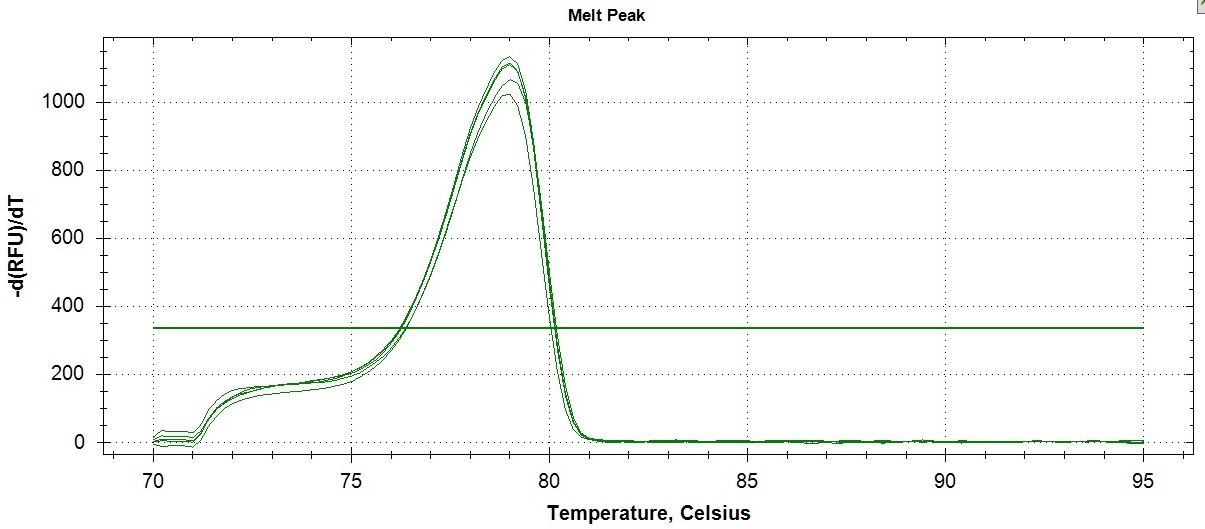
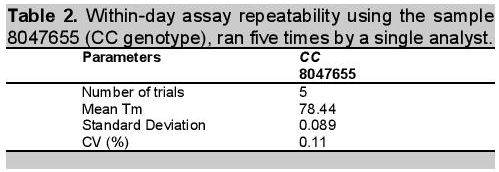
Determination of method precision was conducted in two ways: determination of within day repeatability and on-different day reproducibility using amplicon Tm as reference value. Tm is the temperature at which one-half of a particular DNA duplex dissociates and becomes single strand DNA. To visualize the Tm more clearly, the negative first derivatives may also be applied, as seen in Figure 3. The Tm can be used for assay repeatability since the values vary depending on factors such as the concentration of standard PCR reagents, dsDNA binding dye, DNA, and the rate of transition melting. Figure 3 revealed the within-day repeatability of the method analyzed five times by a single analyst. Values obtained for melting point per assay were very close as shown in the figure and confirmed by computed coefficient of variation (CV) of 0.11% indicating that within-day repeatability of the method was precise (Table 2). The within-day precision includes the contributions from any part of the procedure that varies within a run, including contributions from the pipetting errors due to small mastermix volume (20 uL), heterogeneity of the test material, and variation in the chemical treatment stages of the analysis.
Click here to download Figure 3Figure 3. Results of within-day precision of ATP2B1 amplification assay (sample 8047655 (CC genotype)). The peak is the point where 50% of the PCR products in the sample are denatured.
Click here to download Table 2
Table 2. Within-day assay repeatability using the sample 8047655 (CC genotype), ran five times by a single analyst.
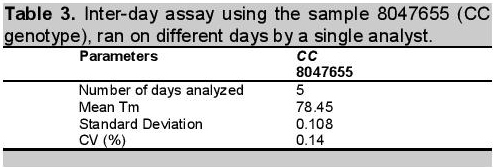
Similarly, result for inter-day or on-different day reproducibility was found to have a very low %RSD of 0.14% (Table 3). This showed that method for ATP2B1 SNP typing was precise when analyzed on different days under a single analyst and analytical conditions. The inter-day precision measures precision variation with time. The variation accounts for additional day-to-day modifications in the analytical system, [e.g. changes of batches of reagents, recalibration of instruments, and the laboratory environment (e.g. temperature changes)].
Click here to download Table 3Table 3. Inter-day assay using the sample 8047655 (CC genotype), ran on different days by a single analyst.
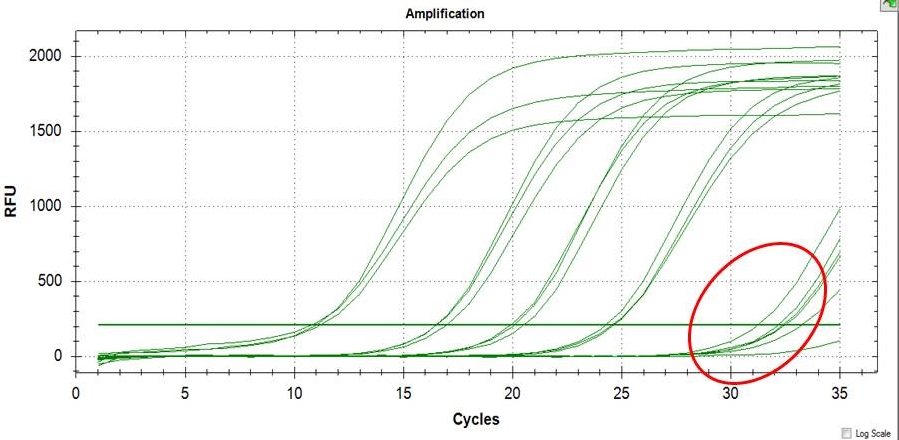
LOD and LOQ were determined using a very low concentration of DNA template containing the SNP of interest as shown in Figure 4. It is useful to state or establish a concentration value limit at which reliable quantification can be made. The values obtained for LOQ (Table 4) represents the value at which the laboratory has demonstrated the ability to measure within the prescribed performance criteria. It establishes the lowest concentration at which data may be reported with confidence in the quantitative accuracy of the data.
Click here to download Figure 4Figure 4. Illustration of LOD of the assay (>30 Ct), LOQ can be readily computed from results of LOQ.
Click here to download Table 4
Table 4. LOD and LOQ of the assay.
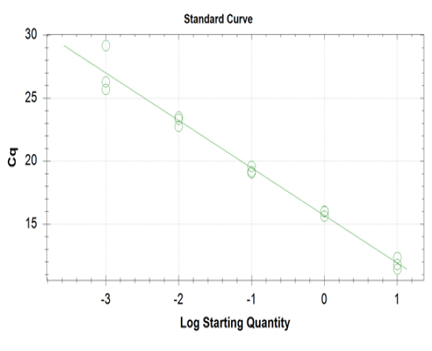
Linearity and PCR efficiency of the method were determined using high concentration of DNA amplicon. Serial dilutions were performed covering five standard points from the highest concentration to the instrument detection limit. Serial dilution per concentration was performed thrice per sample. The instrumental responses in terms of number of cycles, Cq (y-axis) were plotted versus starting DNA concentration (x-axis). Figure 5 shows the linear plot, equation of the line of the generated curve, slope of the line and the linearity coefficient (r) of the assay. A linear relationship exists between the Cq and RFU signal since correlation coefficient has met the acceptance criteria for linearity of calibration curve which is equal to 0.981. A slope (m) smaller than one indicates a decreasing instrument response with increasing DNA concentrations and vice versa (m=-3.77). In addition, linearity of the assay was able to estimate the PCR amplification efficiency from the slope of the log-linear portion of the calibration curve. The theoretical maximum of 1.00 (or 100%) indicates that the amount of product doubles with each cycle, our assay showed a PCR efficiency value of 85%. The acceptable PCR efficiency range is 85-115%.33 Efficiency close to 100% is the best indicator of a robust, reproducible assay.34
Click here to download Figure 5Figure 5. Establishment of linear plot of the assay; The instrumental responses in terms of number of PCR cycles, Cq (y-axis) were plotted versus starting DNA concentration (x-axis).
Finally, the rapidity and simplicity of HRM analysis for establishing genotypic ATP2B1 rs2681472 identity has been shown to be rather attractive. Particularly, the method was shown to be "closed-tube," with the melting curve acquired in the same container used for amplification, and there were no sample processing nor separation steps. However, since the method relied on detection of dye, it is important to note that changing the reagents indicated in this study can lead to poor results. The dsDNA dye is an especially crucial factor and should always be saturating. Saturating dyes should provide the detailed information of melting behavior of an amplicon and the Tm of amplified target should not be altered. In addition, they should not be bound preferentially to purine or pyrimidine bases and inhibit DNA amplification ideally.9 Although it has been shown in multiple literatures that several dyes give rise to good reproducibility for detection of specific known variants, so far their performance for mutation scanning analysis has not been verified nor validated.35,36 Clearly when a different fluorescent dye is found to be more practical in the future, it shall demand showcase of performance quality similar to establishing of critical validation parameters and tests conducted in this paper.
The HRM is a method that can be used for SNP analysis of ATP2B1 rs2681472, a candidate genetic marker for hypertension. The method was found to be accurate and precise, and can thus be used to identify polymorphisms which may be related to or which may cause hypertension.
Investigating the correlation between different ATP2B1 rs2681472, diseases and phenotypes is now feasible applying the method. Moreover, most disorders are ethnicity-dependent, hence a high throughput, efficient, accurate and rapid method to scan the target locus in population may be deemed economical in investigating the correlation of specific lifestyle diseases with genetic factors in different geographical population, including ASEAN countries. It is therefore recommended to assess assay sensitivity and specificity for best results.
1. Lebo RV, Tonk VS. Analyzing the most frequent disease loci in targeted patient categories optimizes disease gene identification and test accuracy worldwide. J Transl Med. 2015;13:16. http://dx.doi.org/10.1186/s12967-014-0333-8.
2. Rubin EH, Allen JD, Nowak JA, Bates SE. Developing precision medicine in a global world. Clin Cancer Res. 2014; 20(6):1419-27. http://dx.doi.org/10.1158/1078-0432.CCR-14-0091.
3. Harbeck N, Sotlar K, Wuerstlein R, et al. Molecular and protein markers for clinical decision making in breast cancer: today and tomorrow. Cancer Treat Rev. 2014;40(3):434-44. http://dx.doi.org/ 10.1016/j.ctrv.2013.09.014.
4. Taillon-Miller P, Kwok P. Efficient approach to unique single-nucleotide polymorphism discovery. Genome Res. 1999;9(5):499-505.
5. Orita M, Iwahana H, Kanazawa H, et al. Detection of polymorphisms of human DNA by gel electrophoresis as single-strand conformation polymorphisms. Proc Natl Acad Sci USA. 1989;86(8):2766-70.
6. Myers RM, Maniatis T, Lerman LS. Detection and localization of single base changes by denaturing gradient gel electrophoresis. Methods Enzymol. 1987;155:501-27.
7. Oefner PJ, Underhill PA. Comparative DNA sequencing by denaturing high-performance liquid chromatography (DHPLC). Am J Hum Genet. 1995;57:A266.
8. Shi M. Enabling large-scale pharmacogenetic studies by high-throughput mutation detection and genotyping technologies. Clin. Chem. 2001;47: 164- 172.
9. Tindall EA, Petersen DC, Woodbridge P, Schipany K, Hayes VM. Assessing high-resolution melt curve analysis for accurate detection of gene variants in complex DNA fragments. Hum Mutat. 2009;30:876-883. http://dx.doi.org/ 10.1002/humu.20919
10. Graham R., Liew M, Meadows C, Lyon E, Wittwer CT. Distinguishing different DNA heterozygotes by high-resolution melting. Clin. Chem. 2005;51(7):1295-1298. http://dx.doi.org/ 10.1373/clinchem.2005.051516
11. Livak KJ. Allelic discrimination using fluorogenic probes and the 5' nuclease assay. Genet Anal. 1999;14:143-149.
12. Totè E, Lamperti M, Bondani M, et al. Full genotyping of a highly polymorphic human gene trait by time-resolved fluorescence resonance energy transfer. PLoS ONE. 2014; 9(9):e107310. http://dx.doi.org/10.1371/journal.pone.0107310
13. Tyagi S, Bratu DP, Kramer FR. Multicolor molecular beacons for allele discrimination. Nat Biotechnol. 1998;16:49-53.
14. Herrmann MG, Durtschi JD, Bromley LK, Wittwer CT, Voelkerding KV. Amplicon DNA melting analysis for mutation scanning and genotyping:cross-platform comparison of instruments and dyes. Clin Chem. 2006(3);52:494-503. http://dx.doi.org/10.1373/clinchem.2005.063438
15. Liew M, Pryor R, Palais R, Meadows C, Erali M, Lyon E, Wittwer CT. Genotyping of single-nucleotide polymorphisms by high-resolution melting of small amplicons. Clin Chem. 2004;50(7):1156-1164. http://dx.doi.org/10.1373/clinchem.2004.032136
16. Zhou L, Wang L, Palais R, Proyor R, Wittwer CT. High-resolution DNA melting analysis for simultaneous mutation scanning and genotyping in solution. Clin. Chem. 2005;51(10):1770-1777. http://dx.doi.org/10.1373/clinchem.2005.054924
17. Worm J, Aggerholm A, Guldberg P. In-tube DNA methylation profiling by fluorescence melting curve analysis. Clin Chem. 2001;47(7):1183-1189.
18. Wittwer CT, Reed G, Gundry C, Vandersteen J, Pryor R. High-resolution genotyping by amplicon melting analysis using LCGreen. Clin Chem. 2003(6);49:853-860. http://dx.doi.org/10.1373/49.6.853
19. Martiniuk A, Lee C, Lawes C, et al. Hypertension: its prevalence and population-attributable fraction for mortality from cardiovascular disease in the Asia-Pacific region. J Hypertens. 2007;25:73-9.
20. DOH steps up blood pressure control for World Health Day. http://www.doh.gov.ph/top/node/8909%20.html. Accessed April 5, 2013.
21. 7th National Nutrition Survey, 2008. http://www.fnri.dost.gov.ph/index.php?option=content&task=view&id=1770. Accessed September 22, 2013.
22. Hottenga JJ, Boomsma DI, Kupper N, Posthuma D, Snieder H, Willemsen G, de Geus EJ. Heritability and stability of resting blood pressure. Twin Res Hum Genet. 2005;8:499-508.
23. Levy D, Ehret GB, Rice K, et al. Genome-wide association study of blood pressure and hypertension. Nat Genet. 2009;41(6):677-687.
24. Thompson M, Ellison S, Wood R. Harmonized guidelines for single laboratory validation of methods of analysis (IUPAC Technical Report). Pure Appl Chem. 2002;74(5):835-855. http://dx.doi.org/10.1351/pac200274050835
25. OECD Guidelines for Quality Assurance in Molecular Genetic Testing (2007). www.oecd.org/sti/biotechnology. Accessed December, 9, 2012.
26. Tabara Y, Kohara K, Kita Y, et al. Common variants in the ATP2B1 gene are associated with susceptibility to hypertension: The Japanese Millennium Genome Project. Hypertension. 2010;56:973-980.
27. Rhee M, Yang S, Woo Oh S, Park Y, et al. Novel genetic variations associated with salt sensitivity in the Korean population. Hypertension Res. 2011;34(5):606-611. http://dx.doi.org/10.1038/hr.2010.278
28. de Vries JJ, Claas EC, Kroes AC, Vossen AC. Evaluation of DNA extraction methods for dried blood spots in the diagnosis of congenital cytomegalovirus infection. Clin Virol. 2009;46(Suppl 4):S37-42. http://dx.doi.org/10.1016/j.jcv.2009.09.001
29. Santos S, Sá D, Bastos E, Guedes-Pinto H, Gut I, Gärtner F, Chaves R. An efficient protocol for genomic DNA extraction from formalin-fixed paraffin-embedded tissues. Res Vet Sci. 2009;86(3):421-6.
30. Untergasser A, Cutcutache I, Koressaar T, Ye J, Faircloth BC, Remm M, Rozen SG. Primer3-new capabilities and interfaces. Nucleic Acids Res. 2012;40(15):e115. http://dx.doi.org/10.1093/nar/gks596
31. Precision Melt Supermix. Application Note No. 10022094. http://www.bio-rad.com/webroot/web/pdf/lsr/literature/10022094.pdf. Assessed December 1, 2011.
32. Von Ahsen N, Oellerich M, Schutz E. Limitations of genotyping based on amplicon melting temperature. Clin Chem. 2001;47(7):1331-2.
33. Glister C, Hatzirodos N, Hummitzsch K, Knight PG, Rodgers JR. The global effect of follicle-stimulating hormone and tumour necrosis factor a on gene expression in cultured bovine ovarian granulosa cells. BMC Genomics. 2014;15:72. http://dx.doi.org/10.1186/1471-2164-15-72.
34. Real time PCR Applications Guide: Biorad. http://www.bio-rad.com/webroot/web/pdf/lsr/literature/Bulletin_5279.pdf. Accessed December 9, 2012.
35. Gudnason H, Dufva M, Bang D, Wolff, A. Comparison of multiple DNA dyes for real-time PCR: effects of dye concentration and sequence composition on DNA amplification and melting temperature. Nucleic Acids Res. 2007;35(19): e127. http://dx.doi.org/10.1093/nar/gkm671.
36. Vali Z, Raz A, Bokharaei H, Nabavi M, et al. Development of a high-resolution melting analysis method based on SYBR Green-I for rs7216389 locus genotyping in asthmatic child patients. Avicenna J of Med Biotechnol. 2014;6(2):72-80.
Authors are required to accomplish, sign and submit scanned copies of the JAFES Declaration that the article represents original material that is not being considered for publication or has not been published or accepted for publication elsewhere.
Consent forms, as appropriate, have been secured for the publication of information about patients; otherwise, authors declared that all means have been exhausted for securing such consent.
The authors have signed disclosures that there are no financial or other relationships that might lead to a conflict of interest. All authors are required to submit Authorship Certifications that the manuscript has been read and approved by all authors, and that the requirements for authorship have been met by each author.