Francesca Paula T. Bautista, MD
Section of Endocrinology, Diabetes and Metabolism
Department of Medicine, St. Luke’s Medical Center, Quezon City
279 E. Rodriguez Sr. Avenue, Quezon City, Philippines 1112
Telefax: +632-8723-0101 local 5210
E-mail: chescabautista_md@yahoo.com
ORCiD: https://orcid.org/0000-0002-8651-3899
e-ISSN 2308-118x
Printed in the Philippines
Copyright © 2019 by the JAFES
Received June 20, 2019. Accepted August 19, 2019.
Published Online First: November 10, 2019.
Objectives. To compare the level of insulin resistance and β-cell function between lean and overweight/obese Filipino patients with newly diagnosed type 2 diabetes mellitus (T2DM).
Methodology. This was a cross-sectional analytical study including newly diagnosed T2DM Filipino patients from St. Luke’s Medical Center - Quezon City. The patients were classified as either lean or overweight/obese. Age, sex, smoking history, anthropometric measures and blood pressure were obtained. Insulin resistance and β-cell function were determined using the homeostasis model assessment (HOMA). The original model (HOMA1) and the updated model (HOMA2) were used.
Results. A total of 80 subjects were included. There were 40 subjects in each group. The overweight/obese subjects had significantly higher mean insulin resistance (HOMA1-IR 9.8±11.7, HOMA2-IR 3.0±2.0) compared to the lean group (HOMA1-IR 2.9±1.5, HOMA2-IR 1.3±0.5). This was consistent in both HOMA1 and HOMA2 (p-values=0.001 and <0.001, respectively). The mean β-cell function of the overweight/obese patients was significantly higher than the lean subjects when using HOMA1 (lean=57.8±35.5, overweight/obese=93.6±66.4, p-value=0.003), but not in HOMA2 (lean=57.6±30.5, overweight/obese=74.8±45.7, p-value=0.051). Overweight/obesity increased HOMA1-IR by 4.0 and HOMA1-B by 46.1 (p-values= 0.002 and <0.001, respectively). Through the use of HOMA2, overweight/ obesity increased HOMA2-IR by 1.4 and HOMA2-B by 29.1 (p-values<0.001). Being overweight/obese was also associated with significantly higher odds for developing greater insulin resistance (HOMA1-IR adjOR = 5.6, 95%CI= 1.7-19.2, p-value=0.005; HOMA2-IR adjOR=10.9, 95%CI=3.4-34.9, p-value<0.001) and lower odds for a decreased β-cell function (HOMA1-B adjOR = 0.2, 95%CI = 0.05-0.9, p-value=0.033; HOMA2-B adjOR=0.2, 95%CI=0.04-0.9, p-value=0.043) compared to being lean.
Conclusion. Newly diagnosed overweight/obese T2DM had higher mean insulin resistance and β-cell function compared to lean T2DM. Overweight/obesity was also associated with higher odds of developing insulin resistance and lower odds for a decreased β-cell function compared to being lean. The overweight/obese T2DM group also had worse metabolic profile manifested by higher FPG, HbA1c, SGPT and blood pressures compared to the lean T2DM group.
Keywords: type 2 diabetes mellitus, insulin resistance, beta-cell function, lean, overweight, obeseType 2 diabetes mellitus (T2DM) exerts a major impact in developing countries, particularly in the Philippines.[1] In 2009, a cohort study derived from a larger populationbased investigation demonstrated a 9-year incidence rate of T2DM in the Philippines to be around 16.3%.[2] T2DM is a chronic metabolic disorder which has been attributed to insulin resistance since the 1930s. Recent studies, however, support the view that T2DM is a heterogeneous disorder where decreased β-cell function is the main genetic factor and insulin resistance is the main acquired factor.[3]
Obesity has been considered as a fundamental aspect behind the worldwide epidemic of T2DM particularly in the western world. In many Asian countries, however, a significant proportion of T2DM patients are considered to be lean.[4] The clinical profile and complications of T2DM differ among lean and obese patients. Lean T2DM has a younger age of onset with male predominance. They are mostly smokers with early failure to oral antidiabetic drugs.[5] Microvascular complications, particularly retinopathy, are highly prevalent among the lean while macrovascular complications are noteworthy among the overweight and obese T2DM patients.[6],[7]
Newer studies have further clustered T2DM into whether they are insulin resistant or deficient. Overweight and obese patients are classified under insulin resistant while lean persons with diabetes are noted to be insulin deficient.[7],[8],[9] In Koreans, regardless of BMI, the development of T2DM was attributed to a defect in insulin secretion.[10] In Hong Kong, the insulin resistance index of newly diagnosed T2DM patients were similar in lean and overweight patients.[11] In a study done in Malaysia with predominantly overweight and obese T2DM patients, diabetes was primarily attributed to insulin resistance.[12]
Insulin resistance on top of β-cells that are incapable of compensating will lead to impaired glycemic control.[13] Similarly, lifestyle modification will be necessary in the management of both lean and overweight or obese T2DM patients. A logical approach in treating T2DM would be to address both the defect in insulin secretion and insulin resistance. However, if lean persons with diabetes are clustered under deficiency in insulin secretion, they will most likely benefit the use of sulfonylureas as an early intervention provided they still have preserved β-cell function.[13],[14]
In the Philippines, there are still limited data on the characteristics of lean and overweight or obese T2DM patients. Understanding their differences will guide us in providing the appropriate cost-effective management that will best suit the patients’ different metabolic profile. The current treatment guidelines are unable to predict which patients will need intensified treatment in either reducing insulin resistance or intensifying β-cell function. Hence, this study aims to compare the insulin resistance (HOMA-IR) and β-cell function (HOMA-B) between lean and overweight/obese T2DM patients.
This was a cross-sectional analytical study conducted at St. Luke’s Medical Center – Quezon City (SLMC-QC), a tertiary hospital in the Philippines, from January to December 2018. This study included all adult Filipino patients ≥18 years old, both from the social service and private divisions, who were newly diagnosed with T2DM, defined as diagnosis within one year prior to study enrollment. The exclusion criteria included the following: those who had other medical conditions including malignancy, cardiac failure, cirrhosis, end stage renal disease, chronic obstructive pulmonary disease and trauma requiring hospitalization or surgical intervention; those who used anti-diabetic medications, including both insulin and oral agents, within the past two weeks prior to study enrollment; those who took medications that altered insulin sensitivity like prazosin, diuretics, steroids and oral contraceptive pills within the past three months prior to study enrollment; those who had intentional or unintentional weight loss, either a decrease of ≥5% of baseline body weight or a change in BMI category within one year prior to inclusion in the study. Pregnant women with gestational diabetes mellitus (GDM); history of GDM per se, however, was not part of the exclusion criteria. Subjects who had other endocrinopathies including thyrotoxicosis, acromegaly, prolactinoma, hypopituitarism, adrenal insufficiency, Cushing’s disease or any other syndrome where T2DM was part of the presentation. Lastly, vulnerable populations such as those with mental retardation or psychological disorders were not included.
All newly diagnosed T2DM patients based on the American Diabetes Association (ADA) 2018 criteria (FBS ≥126 mg/dL, HbA1c ≥6.5% or classic symptoms of hyperglycemia with a random plasma glucose ≥200 mg/dL) were recruited for inclusion in the study. This included all patients consulting in both the social service out patient department (SS-OPD) and in the private clinics. Patients who were admitted solely for executive/ diagnostic check up but otherwise asymptomatic were included. An informed consent form (ICF) was subsequently obtained from all the patients who met the inclusion criteria. The ICF was taken at the clinic after fully explaining the study. After the patient consented, he was given a copy of the ICF. The demographics and clinical profile of the study participants were taken through a detailed history and physical examination. Data included age, sex, hypertension, and smoking history in pack years. The patient’s anthropometric measures including height, weight, waist and hip circumference were attained. Height and weight were measured using a similar type of stadiometer and weighing scale in all patients. Waist and hip circumference were measured by the use of the same tape measure as well. Blood pressure was taken through a calibrated sphygmomanometer. Compliance to the intake of anti-hypertensive medications was asked. They were then classified according to their body mass index (BMI). Subjects who had BMI in the underweight to normal range were classified as lean while those in the overweight and obese range were classified together. The World Health Organization’s classification of BMI in adult Asians was used. Categorization was as follows: underweight (<18.5 kg/m2), normal (18.5-22.9 kg/ m2), overweight (23-24.9 kg/m2), obese I (25-29.9 kg/m2) and obese II (≥30 kg/m2). Subsequently, patients were advised to have a 12-hour overnight fasting. Blood extraction was done at the laboratory using two yellow tops containing 3.5 mL of blood each. After which, the following biochemical parameters were obtained: fasting plasma glucose, fasting insulin, HbA1c, serum creatinine, estimated glomerular filtration rate, SGPT and lipid profile. Insulin resistance and β-cell function were compared between the two groups using the Homeostatic Model Assessment (HOMA). Both the original model (HOMA1) and the updated model containing physiological modifications in a computer version (HOMA2) were used. HOMA1 computation were as follows: HOMA-IR=fasting insulin concentration (mIU/L) x fasting blood glucose concentration (mmol/L) divided by 22.5; HOMA-B=20 x fasting insulin concentration (mIU/L) divided by [fasting blood glucose concentration (mmol/L) –3.5].[15] The HOMA2 calculator was downloaded from the University of Oxford, Center for Diabetes, Endocrinology and Metabolism, Diabetes Trial Unit (http://www.dtu. ox.ac.uk/homacalculator). The cut-off values for the definition of insulin resistance were HOMA1-IR ≥2.[9] and HOMA2-IR ≥1.7.[16],[17] Insulin deficiency, on the other hand, was defined as HOMA1-B ≤48.9% and HOMA2-B ≤54.2%.[18]
A total of 80 newly diagnosed T2DM subjects (40 subjects from the lean group and 40 subjects from the overweight/ obese group) were recruited in this study. Power analysis performed showed that the linear and logistic regression models fitted in this study (i.e. HOMA1-IR, HOMA2-IR, HOMA1-B, and HOMA2-B models) had at least 90% with this sample size. Power analysis was conducted using G*Power 3.0.10 software.
Statistical analysis
Statistical analysis was done using STATA14. Quantitative variables were summarized using mean and standard deviation. The qualitative variables were summarized using frequencies and percentages. Comparison of the HOMA-IR, HOMA-B, and other continuous variables between lean and overweight/obese T2DM was done using student’s t-test. Multiple linear regression was done to assess the association between overweight/obesity and HOMA-IR/HOMA-B values. Multiple logistic regression was done to assess the association between overweight/ obesity and HOMA-IR/HOMA-B. Potential confounders (age, sex, SGPT, HBA1C) identified through related literature were controlled in the multiple linear and logistic regression models.
Ethical consideration
The clinical protocol and all relevant documents were reviewed and approved by the SLMC-QC Institutional Ethics Review Committee. Confidentiality and anonymity were ensured with the use of data generated code. The main investigator was responsible for the integrity of the data including accuracy, completeness and legibility. The manner of disseminating and communicating the study results guaranteed the protection of the patient’s confidentiality. The principal investigator shouldered the laboratory tests needed where the funds came from the SLMC-QC Research and Biotechnology Division and the PSEDM-Servier research grant.
A total of 80 subjects were included in the study. There were 40 subjects in each group. The clinical and demographic characteristics of the study population are shown in Table 1. The mean age of lean T2DM patients was 55.5±12.1 years old while the overweight/obese patients had a mean age of 46.5±12.0 years old. In terms of sex, most of the subjects were females (lean=72.5%, overweight/obese=52.4%). The mean systolic and diastolic blood pressures were 110.5±14.1/70.5±9.3 mmHg among the lean T2DM and 128.8±11.7/ 81.4±7.2 mmHg among the overweight/obese T2DM. The proportion of smokers were as follows, lean=10% and overweight/obese=11.9%.
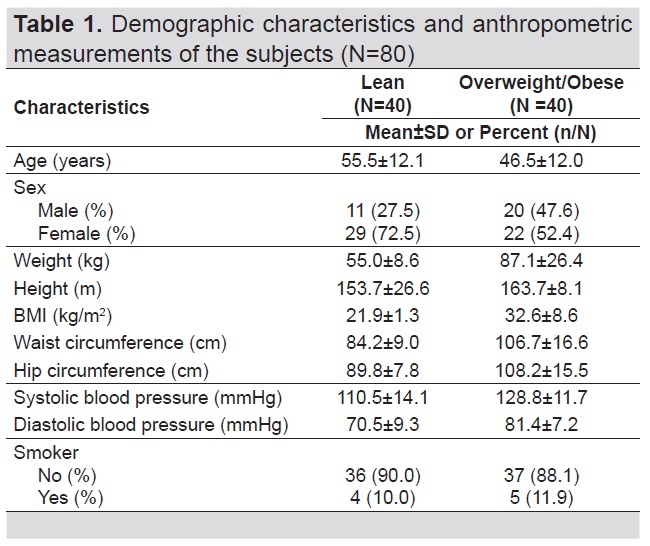
Table 1. Demographic characteristics and anthropometric measurements of the subjects (N=80)
The biochemical parameters of the subjects included in the study are shown in Table 2. There was a significant difference in the mean fasting plasma glucose between the two groups (lean=142.0±64.9 mg/dL, overweight/ obese=174.9±73.5 mg/dL, p-value=0.035). There was significantly higher mean fasting insulin (p-value=<0.001), HbA1c (p-value=0.043) and SGPT (p-value=0.027) among overweight/obese patients compared to lean patients. In contrast, no significant differences were observed in terms of lipid profile (total cholesterol, p-value=0.901; triglycerides, p-value=0.492; LDL, p-value=0.637; HDL, p-value=0.267) and creatinine level (p-value=0.509) between the two groups.
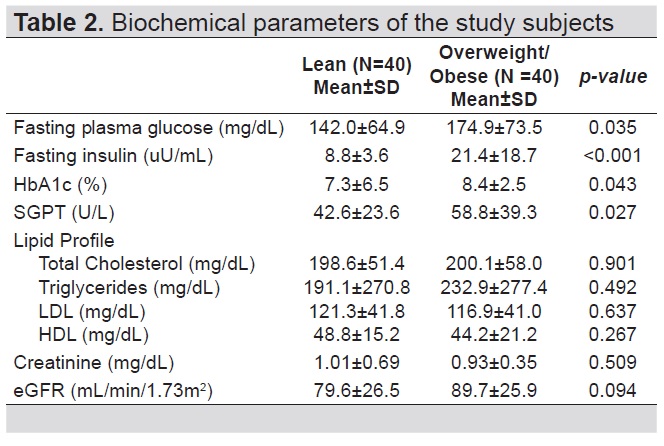
Table 2. Biochemical parameters of the study subjects
The differences in insulin resistance and β-cell function between the two groups are shown in Table 3. In both HOMA1 and HOMA2, overweight/obese patients (HOMA1-IR 9.8±11.7, HOMA2-IR 3.0±2.0) had significantly higher mean HOMA-IR values (HOMA1- IR p-value=0.001, HOMA2-IR p-value<0.001) compared to lean patients (HOMA1-IR 2.9±1.5, HOMA2-IR 1.3±0.5). In terms of HOMA-B levels, overweight/obese subjects had significantly higher values compared to lean subjects when using HOMA1 (lean=57.8±35.5, overweight/obese = 93.6±66.4, p-value=0.003). This difference in HOMA-B levels was not observed when using HOMA2 (lean=57.6±30.5, overweight/obese=74.8±45.7, p-value=0.051).
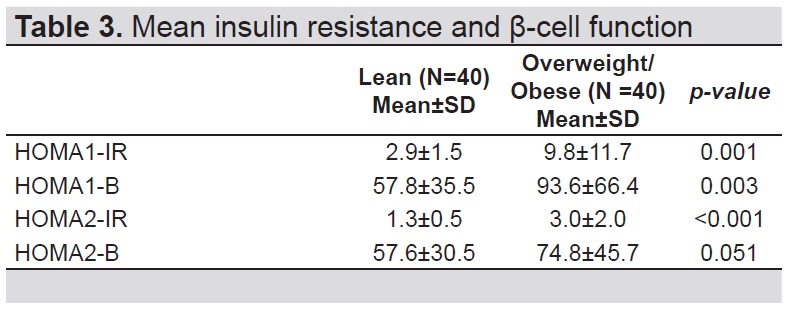
Table 3. Mean insulin resistance and β-cell function
Being overweight/obese was significantly associated with increased insulin resistance and β-cell function (Table 4). Using HOMA1, being overweight/obese significantly increased HOMA-IR value by 4.0 (95%CI=1.5-6.5, p-value=0.002) and HOMA-B value by 46.1 (95%CI=26.0-66.1, p-value<0.001) compared to being lean. Using HOMA2, being overweight/obese significantly increased HOMA-IR value by 1.4 (95%CI=0.6-2.1, p-value<0.001) and HOMA-B value by 29.1 (95%CI=15.6- 42.7, p-value<0.001) compared to being lean. Age, sex, SGPT and HBA1C were adjusted as potential confounders in the regression models.
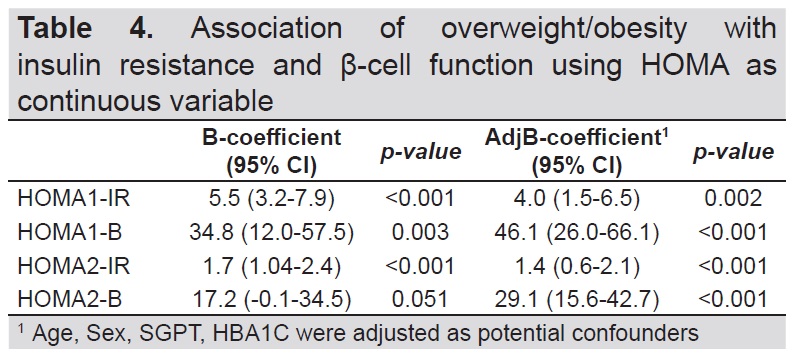
Table 4. Association of overweight/obesity with insulin resistance and β-cell function using HOMA as continuous variable
As shown in Table 5, being overweight/obese was significantly associated with elevated HOMA values (insulin resistance and β-cell function). Through the use of HOMA1, overweight/obese T2DM subjects had significantly higher odds in having an increased HOMA-IR (adjOR=5.6, 95%CI=1.7-19.2, p-value=0.005) and significantly lower odds in developing a decreased HOMA-B (adjOR=0.2, 95%CI=0.05-0.9, p-value=0.033) compared to lean T2DM subjects. Upon the use of HOMA2, similar trend was observed. Overweight/ obese T2DM patients had significantly higher odds for an elevated HOMA-IR (adjOR=10.9, 95%CI=3.4-34.9, p-value<0.001) and significantly lower odds for a decreased HOMA-B (adjOR=0.2, 95%CI=0.04-0.9, p-value=0.043) compared to lean T2DM patients. Age, sex, SGPT and HBA1C were also adjusted as potential confounders in the regression models.
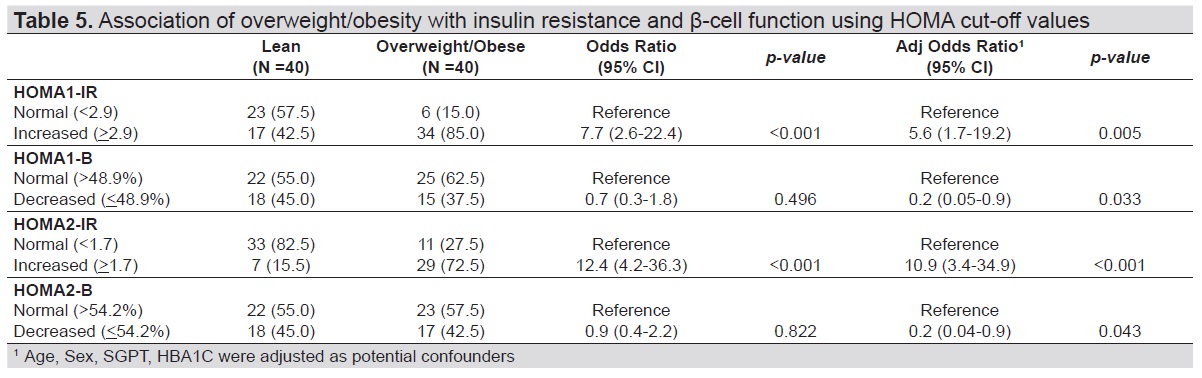
Table 5. Association of overweight/obesity with insulin resistance and β-cell function using HOMA cut-off values
The levels of insulin resistance and β-cell function differed between the lean and overweight/obese newly diagnosed T2DM. The measurement of insulin resistance and β-cell function was done through the use of HOMA. HOMA1 is the original model consisting of mathematical computation widely used in epidemiological and clinical studies while HOMA2 is the updated computer model. The updated version accounts for variations in hepatic and peripheral glucose resistance providing a more accurate index.[15],[17] Wallace et al.,[15] further emphasized that HOMA allocates the basal state of insulin and glucose in terms of resistance and β-cell function. Hence, if the β-cell function data will be reported in isolation, a mistaken assumption can be made that the subject has failing β-cells contrary to an appropriately low secretion due to high insulin sensitivity of the body. Insulin resistance was defined as HOMA1-IR ≥2.9 and HOMA2-IR ≥1.7 while β-cell dysfunction was labeled as HOMA1-B ≤48.9% and HOMA2-B ≤54.2%.[16],[17],[18]
In our study, both HOMA1 and HOMA2 showed that overweight/obese T2DM subjects had significantly higher mean HOMA-IR values compared to the lean T2DM group (p-values=0.001 and <0.001, respectively). Overweight/ obesity was also associated with higher odds of having increased insulin resistance consistent to both HOMA1-IR and HOMA2-IR (p-values=0.005 and <0.001, respectively) compared to lean T2DM subjects. This supported previous data that insulin resistance was significantly increased in overweight/obese T2DM patients.[19],[20],[21] Chung et al.,[20] indicated that BMI had a positive relationship with indices of insulin resistance. The mechanism of insulin resistance in overweight/obese subjects had been attributed to chronic inflammation, mitochondrial dysfunction, hyperinsulinemia, lipotoxicity or energy surplus mediated by adenosine triphosphate (ATP).[21] In terms of HOMA-B, the overweight/obese T2DM group had statistically significant higher mean values when using HOMA1 (p-value=0.003) but the difference was not statistically significant when using HOMA2 (p-value=0.051). The HOMA2-B trend, however, was still observed to be higher in the overweight/obese patients. Overweight/obesity was also associated with significantly lower odds in having decreased β-cell function compared to the lean group. This trend was consistent in both HOMA1-B and HOMA2-B (p-value=0.033 and 0.043, respectively). It is noteworthy that the HOMA1 model was calibrated to an insulin assay used in the 1970s, hence, may fluctuate in the assessment of β-cell function when compared with the newer assays.[15],[22] Thus, in assessing β-cell function, the computer model (HOMA2) is preferably used as this has been recalibrated in line with current insulin assays.
In our study, the difference in the mean HOMA2-B values between the two groups might not be statistically significant (p-value=0.051), but this could still be of marked clinical value when interpreted in relation to the HOMA-IR. Therefore, with a higher HOMA-IR and HOMA-B values in the overweight/obese newly diagnosed T2DM subjects, it could be deduced that they still had preserved β-cell function that was able compensate with the higher insulin resistance. Ferrannini[23] noted that as insulin resistance increased, β-cells compensated by increasing insulin secretion leading to hyperinsulinemia. In another study, it was also observed that obesity was associated with an increase in β-cell mass where the upsurge in BMI was correlated with a rise in β-cell function. They further noted that obesity could be a form of primary insulin hypersecretion.[24] The lean group, on the other hand, were more insulin sensitive as evidenced by a lesser percentage of insulin resistant individuals along with lower mean HOMA-IR and HOMA-B levels.
Between the two groups, the newly diagnosed lean T2DM were clinically better compared to the overweight/obese group, taking into consideration the lower mean FPG, HbA1c, fasting insulin and SGPT. The β-cells of the lean T2DM subjects did not have to compensate to produce more insulin to maintain normal glucose tolerance.
With these findings, it is reasonable to conclude that an individualized cost-effective treatment should be established for every T2DM patient. It is necessary to understand their residual β-cell function and corresponding insulin resistance. The outcome of our study was dissimilar to the data of Ahlqvist et al.,[7] and Hartmann et al.,[25] which clustered lean persons with diabetes under insulin deficiency, having shortest time to second oral diabetic drugs, with less benefit to metformin and more often treated with insulin. Our findings were congruent to the data of Das9 and Barma et al.,[26] that lean T2DM could achieve good glycemic control with oral diabetic agents. In particular, since the lean T2DM subjects of our study were more insulin sensitive, (likely with preserved β-cell function) and weight loss was not key in its management, these patients could benefit the most from insulin secretagogues like sulfonylureas. Newly diagnosed overweight/obese T2DM, on the other hand, having higher insulin resistance would have a favorable response to an insulin sensitizer like metformin. This would not only enhance insulin sensitivity but would also preserve β-cell function. Therapeutic interventions should have an emphasis on the reduction of insulin resistance and preservation of β-cell function.
Lean and overweight/obese T2DM also had differences in their demographic and biochemical parameters. Decrease in insulin sensitivity and β-cell function had been correlated to aging. This was attributed to the changes in body composition, decrease in skeletal muscle mitochondrial function and age-related impairment of pancreatic endocrine function.[27],[28],[29] Karakelides et al.,[30] however, noted that age had no independent effect on insulin resistance. Scheen[31] and Imbeault et al.,[32] further noted that increasing age per se did not influence glucose homeostasis and was not a cause of insulin resistance. Hence, the role of age in decreasing insulin sensitivity and β-cell function in the older population has to be further evaluated.
In the present study, lean T2DM group were older compared to the overweight/obese group. Despite being older though, they were noted to have better insulin sensitivity than the overweight/obese group. The association of age to insulin resistance and β-cell function, however, could not be well established in this study due to the method of sampling. As regards to sex, majority of the subjects were females. Geer and Shen[33] indicated that there is an elevated visceral and hepatic adiposity reported in males. Along with lower adiponectin levels and absence of estrogen, males are noted to have higher insulin resistance compared to females.[33] Similar to age, the relationship of sex to insulin resistance and β-cell function could not be generalized in this study due to the sampling method used.
The mean systolic and diastolic blood pressures of the overweight/obese group were also higher compared to the lean group. This was congruent to the study of Shikha et al.,[34] that daytime, nocturnal and 24-hour mean systolic blood pressure were significantly higher in obese subjects. Obesity is known as a major risk for hypertension because it surges tubular reabsorption impairing pressure natriuresis resulting to volume expansion thru the activation of the renin-angiotensin system.[35]
The proportion of smokers between the two groups was comparable in this study. This was similar to the study of Mohan et al.,[6] indicating that there was no significant difference in the smoking habits of the two groups. Keith et al.,[36] further noted that there was no consistent association between tobacco use and insulin resistance regardless of whether the subject was a persistent smoker or a quitter. This was in contrast to other previous studies, which noted that lean T2DM were mostly smokers.[5],[25] Nagaya et al.,[37] on the other hand, noted that heavy smoking moderately increased the risk of diabetes in obese men while light smoking reduced the risk in lean men. The association of smoking in T2DM, whether in the lean or overweight/obese group may require more extensive studies.
In the analysis of the biochemical parameters, mean fasting plasma glucose (FPG) and HbA1c were significantly higher in the overweight/obese group compared to the lean (p-values=0.035 and 0.043, respectively). This was consistent to previous studies, which explained that obesity was associated to chronic systemic inflammation because adipose tissues release pro-inflammatory substances and non-esterified fatty acids (NEFA). Apart from inflammatory state having a fundamental role in the development of insulin resistance, NEFA secreted from adipose tissues also lead to insulin resistance and β-cell dysfunction, thereby resulting to poor glycemic control.[38],[39],[40] Other studies, however, showed that lean T2DM had more severe hyperglycemia attributed to early β-cell failure or more severe β-cell dysfunction.[6],[41] In both groups, there was no significant derangement in liver function represented by SGPT in this study. It can be observed though, that the SGPT level in the overweight/ obese group was higher compared to the lean T2DM subjects (p-value=0.027). Being overweight or obese had been associated with expanded adipose tissue that resulted to chronic inflammation. This lead to a problem in the normal storage and endocrine functions of adipose tissues that also altered the metabolic state of the liver.[42]
In terms of lipid profile, there was no significant differences observed between the two groups. This was contrary to the data of Das[9] that BMI had a positive relationship with LDL and that lean persons with diabetes had lower incidence of dyslipidemia with a generally favorable lipid profile. Both lean and overweight/obese T2DM subjects in our study probably had preserved β-cell function that was able to compensate the presence of insulin resistance in the peripheral bed leading to better hepatic handling of lipids. Renal function did not also differ between the two study groups (p-value=0.094). This was mainly attributed to the fact that subjects enrolled in this study were newly diagnosed with T2DM, hence, complications of diabetes might not yet be present.
The overweight/obese newly diagnosed T2DM patients had higher mean insulin resistance and β-cell function compared to lean T2DM patients. Overweight/obesity was also associated with higher odds of having increased insulin resistance and lower odds of developing decreased β-cell function compared to the lean group. The overweight/obese T2DM had worse metabolic profile manifested by higher FPG, HbA1c, SGPT and blood pressures compared to lean T2DM.
Limitations and recommendation
Due to the nature of the research design, the level of β-cell function (HOMA-B) cannot be interpreted in isolation and may not reflect the true β-cell reserve. A cohort design may be better to determine the rate of β-cell deterioration.
The population included in this study also represented the highly urbanized patients from Metro Manila only and may not represent the T2DM Filipinos from the rural areas. The subject’s levels of physical activity, which may influence insulin resistance, were not assessed in detail as well. Further studies can be done in the future which should take the aforementioned issues into consideration.
Acknowledgments
The authors sincerely thank the active consultants and trainees of SLMC-QC particularly the medical residents of Internal Medicine and the fellows in training of the other subspecialties for helping us in enrolling newly diagnosed T2DM subjects in this study. They are also grateful to the SLMC-QC Research and Biotechnology group.
Statement of AuthorshipAll authors certified fulfillment of ICMJE authorship criteria.
Author DisclosureThe authors declared no conflict of interest
Funding SourcePSEDM-Servier Research Grant in Diabetes Year 2018 aided in funding this study.
[1] Tan GH. Diabetes care in the Philippines. Ann Glob Health. 2015;81(6):863-9.
[2] Soria ML, Sy RG, Vega BS, et al. The incidence of type 2 diabetes
mellitus in the Philippines: A 9-year cohort study. Diabetes Res Clin
Pract. 2009;86(2):130-3.
[3] Gerich JE. Contributions of insulin-resistance and insulin-secretory
defects to the pathogenesis of type 2 diabetes mellitus. Mayo Clin Proc.
2003;78(4):447-56.
[4] Brunetti P. The lean patient with type 2 diabetes: Characteristics and
therapy challenge. Int J Clin Pract Suppl. 2007;61(10):1776.
[5] George AM, Jacob AG, Fogelfeld L. Lean diabetes mellitus: An
emerging entity in the era of obesity. World J Diabetes. 2015;6(4):613-
20.
[6] Mohan V, Vijayaprabha R, Rema M, et al. Clinical profile of lean
NIDDM in South India. Diabetes Res Clin Pract. 1997;38(2):101-8.
[7] Ahlqvist E, Storm P, Käräjämäki, A, et al. Novel subgroups of
adult-onset diabetes and their association with outcomes: A datadriven
cluster analysis of six variables. Lancet Diabetes Endocrinol.
2018;6(5):361-9.
[8] Suraamornkul S, Kwancharoen R, Ovartlarnporn M, Rawdaree P,
Bajaj M. Insulin clamp-derived measurements of insulin sensitivity
and insulin secretion in lean and obese asian type 2 diabetic patients.
Metab Syndr Relat Disord. 2010;8(2):113-8.
[9] Das S. Lean type 2 diabetes mellitus: Profile, peculiarities and paradox.
Medicine Update. 2008;18: 94-104.
https://pdfs.semanticscholar. org/6ecf/6ca750e544ba2ced659e0ab615ca6d6fe524.pdf
[10] Kim DJ, Lee MS, Kim KW, Lee MK. Insulin secretory dysfunction
and insulin resistance in the pathogenesis of Korean type 2 diabetes
mellitus. Metabolism. 2001; 50(5):590-3.
[11] Chan WB, Tong PC, Chow CC, et al. The associations of body mass
index, C-peptide and metabolic status in Chinese Type 2 diabetic
patients. Diabet Med. 2004;21(4):349–53.
[12] Foo HW, Chan SP, Ismail B, Awang B. Insulin resistance is the
predominant pathophysiologic feature of hyperglycemia in newly
diagnosed overweight and obese type 2 diabetes mellitus patients
in two university hospitals in Malaysia. J ASEAN Fed Endocr Soc.
2011;26(2): 143-9.
[13] Burks DJ, White MF. IRS proteins and β-cell function. Diabetes.
2001;50(Suppl 1):140-5.
[14] Del Prato S, Pulizzi N. The place of sulfonylureas in the therapy for
type 2 diabetes mellitus. Metabolism. 2006;55(5 Suppl 1):S20-7.
[15] Wallace TM, Levy JC, Matthews DR. Use and abuse of HOMA
modeling. Diabetes Care. 2004;27(6):1487-95.
[16] Safar FH, Mojiminiyi OA, Al-Rumaih HM, Diejomaoh MF.
Computational methods are significant determinants of the associations
and definitions of insulin resistance using the homeostasis model
assessment in women of reproductive age. Clin Chem. 2011;57(2):279-
85.
[17] Geloneze B, Vasques AC, Stabe CF, et al. HOMA1-IR and HOMA2-
IR indexes in identifying insulin resistance and metabolic syndrome:
Brazilian Metabolic Syndrome Study (BRAMS). Arq Bras Endocrinol
Metab. 2009;53(2): 281-7.
[18] Elsafty A, Nabhan S, Mahmoud MSH, Azzazy H. Specific cutoffs
for HOMA1-IR, HOMA2-IR, HOMA1-%B, HOMA2-%B in adult
Egyptian patients. Ann J Clin Pathol. 2018; 150(Suppl 1):S66.
[19] Zelada H, Carnero A, Hurtado CM, et al. Beta-cell function and
insulin resistance among Peruvian adolescents with type 2 diabetes.
J Clin Transl Endocrinol. 2016;5:15-20.
[20] Chung JO, Cho DH, Chung DJ, Chung MY. Associations among body
mass index, insulin resistance, pancreatic β-cell function in Korean
patients with new-onset type 2 diabetes. Korean J Intern Med. 2012;
27(1): 66-71.
[21] CYe J. Mechanisms of insulin resistance in obesity. Front Med.
2013;7(1):14-24.
[22] Muniyappa R, Lee S, Chen H, Quon MJ. Current approaches for
assessing insulin sensitivity and resistance in vivo: Advantages,
limitations and appropriate usage. Am J Physiol Endocrinol Metab.
2008;294(1):E15-26.
[23] Ferrannini E. Insulin resistance versus insulin deficiency in noninsulin
dependent diabetes mellitus: Problems and prospects. Endocr
Rev. 1998;19(4):477-90.
[24] Ferrannini E, Camastra S, Gastaldelli A, et al. Beta-cell function in
obesity: Effects of weight loss. Diabetes. 2004;53(Suppl 3):S26-33.
[25] Hartmann B, Lanzinger S, Bramlage P, et al. Lean diabetes in
middle-age adults: A joint analysis of the German DIVE and DPV
registries. PloS ONE. 2017;12(8): e0183235.
[26] Barma PD, Ranabir S, Prasad L, Singh TP. Clinical and biochemical
profile of lean type 2 diabetes mellitus. Indian J Endocrinol Metab.
2011;15(5):40-3.
[27] Ford ES, Giles WH, Dietz WH. Prevalence of the metabolic syndrome
among US adults: Findings from the Third National Health and
Nutrition Examination Survey. JAMA. 2002; 287(3):356–9.
[28] Petersen KF, Befroy D, Dufour S, et. al. Mitochondrial dysfunction
in the elderly: Possible role in insulin resistance. Science.
2003;300(5622):1140-2.
[29] De Tata V. Age-related impairment of pancreatic beta-cell function:
Pathophysiological and cellular mechanisms. Front Endocrinol
(Lausanne). 2014;5:138.
[30] Karakelides H, Irving BA, Short KR, O’Brien P, Nair KS. Age, obesity
and sex effects on insulin sensitivity and skeletal muscle mitochondrial
function. Diabetes. 2010;59(1):89-97.
[31] Scheen AJ. Diabetes mellitus in the elderly: Insulin resistance and/or
impaired insulin secretion? Diabetes Metab. 2005;31(Spec No. 2):5S27-
34.
[32] Imbeault P, Prins JB, Stolic M, et. al. Aging per se does not influence
glucose homeostasis: In vivo and in vitro evidence. Diabetes
Care. 2003;26(2):480-4.
[33] Geer E, Shen W. Gender differences in insulin resistance, body
composition, and energy balance. Gend Med. 2009;6(Suppl 1):60-75.
[34] Shikha D, Singla M, Walia R, et al. Ambulatory blood pressure
monitoring in lean, obese and diabetic children and adolescents.
Cardiorenal Med. 2015;5(3):183-90.
[35] Jiang SZ, Lu w, Zong XF, Ruan HY, Liu Y. Obesity and hypertension.
Exp Ther Med. 2016;12(4):2395-9.
[36] Keith RJ, Al Rifai M, Caruba C, et al. Tobacco use, insulin resistance,
and risk of type 2 diabetes: Results from the multi-ethnic study of
atherosclerosis. PLoS ONE. 2016;11(6): e0157592.
[37] Nagaya T, Yoshida H, Takahashi H, Kawai M. Heavy smoking raises
risk for type 2 diabetes mellitus in obese men; but, light smoking
reduces the risk in lean men: A follow-up study in Japan. Ann
Epidemiol. 2008;18(2):113-8.
[38] Asegaonkar SB, Karee I, Aghade S, Pagdhune A, Thorat A, Borkar
MS. Metabolic status of lean, overweight, and obese type 2 diabetes
mellitus patients. Indian J Med Biochem. 2016; 20(1): 6-10.
[39] Akter R, Nessa A, Husain MF, et al. Effect of obesity on fasting blood
sugar. Mymensingh Med J. 2017; 26(1):7-11.
[40] Al-Goblan AS, Al-Alfi MA, Khan MZ. Mechanism linking diabetes
mellitus and obesity. Diabetes Metab Syndr Obes. 2014;7:587-91.
[41] Coleman NJ, Miernik J, Philipson L, Fogelfeld L. Lean versus obese
diabetes mellitus patients in the United States minority population.
J Diabetes Complications. 2014; 28(4):500-5.
[42] Qureshi K, Abrams GA. Metabolic liver disease of obesity and role of
adipose tissue in the pathogenesis of nonalcoholic fatty liver disease.
World J Gastroenterol. 2007; 13(26): 3540-53.
PubMed
PubMed Central
CrossRef
Authors are required to accomplish, sign and submit scanned copies of the JAFES Author Form consisting of: (1) Authorship Certification, that all the requirements for authorship have been met by each author, and that the final version of the manuscript has been read and approved by all authors; (2) the Author Declaration, that the article represents original material that is not being considered for publication or has not been published or accepted for publication elsewhere; (3) the Statement of Copyright Transfer [accepted manuscripts become the permanent property of the JAFES and are licensed with an Attribution-Share Alike-Non-Commercial Creative Commons License. Articles may be shared and adapted for non-commercial purposes as long as they are properly cited]; and the ICMJE form for Disclosure of Potential Conflicts of Interest. For original articles, authors are required to submit a scanned copy of the Ethics Review Approval of their research as well as registration in trial registries as appropriate. For manuscripts reporting data from studies involving animals, authors are required to submit a scanned copy of the Institutional Animal Care and Use Committee approval. For Case Reports or Series, and Images in Endocrinology, consent forms, are required for the publication of information about patients; otherwise, appropriate ethical clearance has been obtained from the institutional review board. Articles and any other material published in the JAFES represent the work of the author(s) and should not be construed to reflect the opinions of the Editors or the Publisher.